Biden wins a historic victory in Milwaukee County, driven by growing Democratic strength in the suburbs
Joseph Biden and Kamala Harris netted a larger number of votes than any other Democrat in Milwaukee County’s history. According to unofficial returns, they received 182,896 more votes than Donald Trump and Mike Pence. In percentage terms, this 40-point margin of victory is only exceeded by Franklin Delano Roosevelt’s 1932 and 1936 campaigns (45- and 56-point victories, respectively), going back at least to 1892.
The City of Milwaukee delivered its usual overwhelmingly Democratic trove of votes, but it did not contribute more dramatically to this record-breaking performance. Rather, a remarkable blue wave in Milwaukee’s innermost suburbs further recast the region’s political complexion. In the City of Milwaukee net votes cast for the Biden/Harris ticket exceeded those cast for Clinton in 2016 by about 3,000 votes. However, the Milwaukee county suburbs collectively netted the Democratic ticket over 17,000 more votes in 2020 than 2016.
| Net votes for the Democratic presidential candidate in the City of Milwaukee and the Milwaukee County suburbs | ||
|---|---|---|
| suburbs | city | |
| 2000 | −7,685 | 96,523 |
| 2004 | −5,795 | 123,161 |
| 2008 | 14,594 | 155,781 |
| 2012 | 6,391 | 171,122 |
| 2016 | 19,475 | 143,278 |
| 20201 | 36,663 | 146,233 |
|
1
unofficial returns
|
||
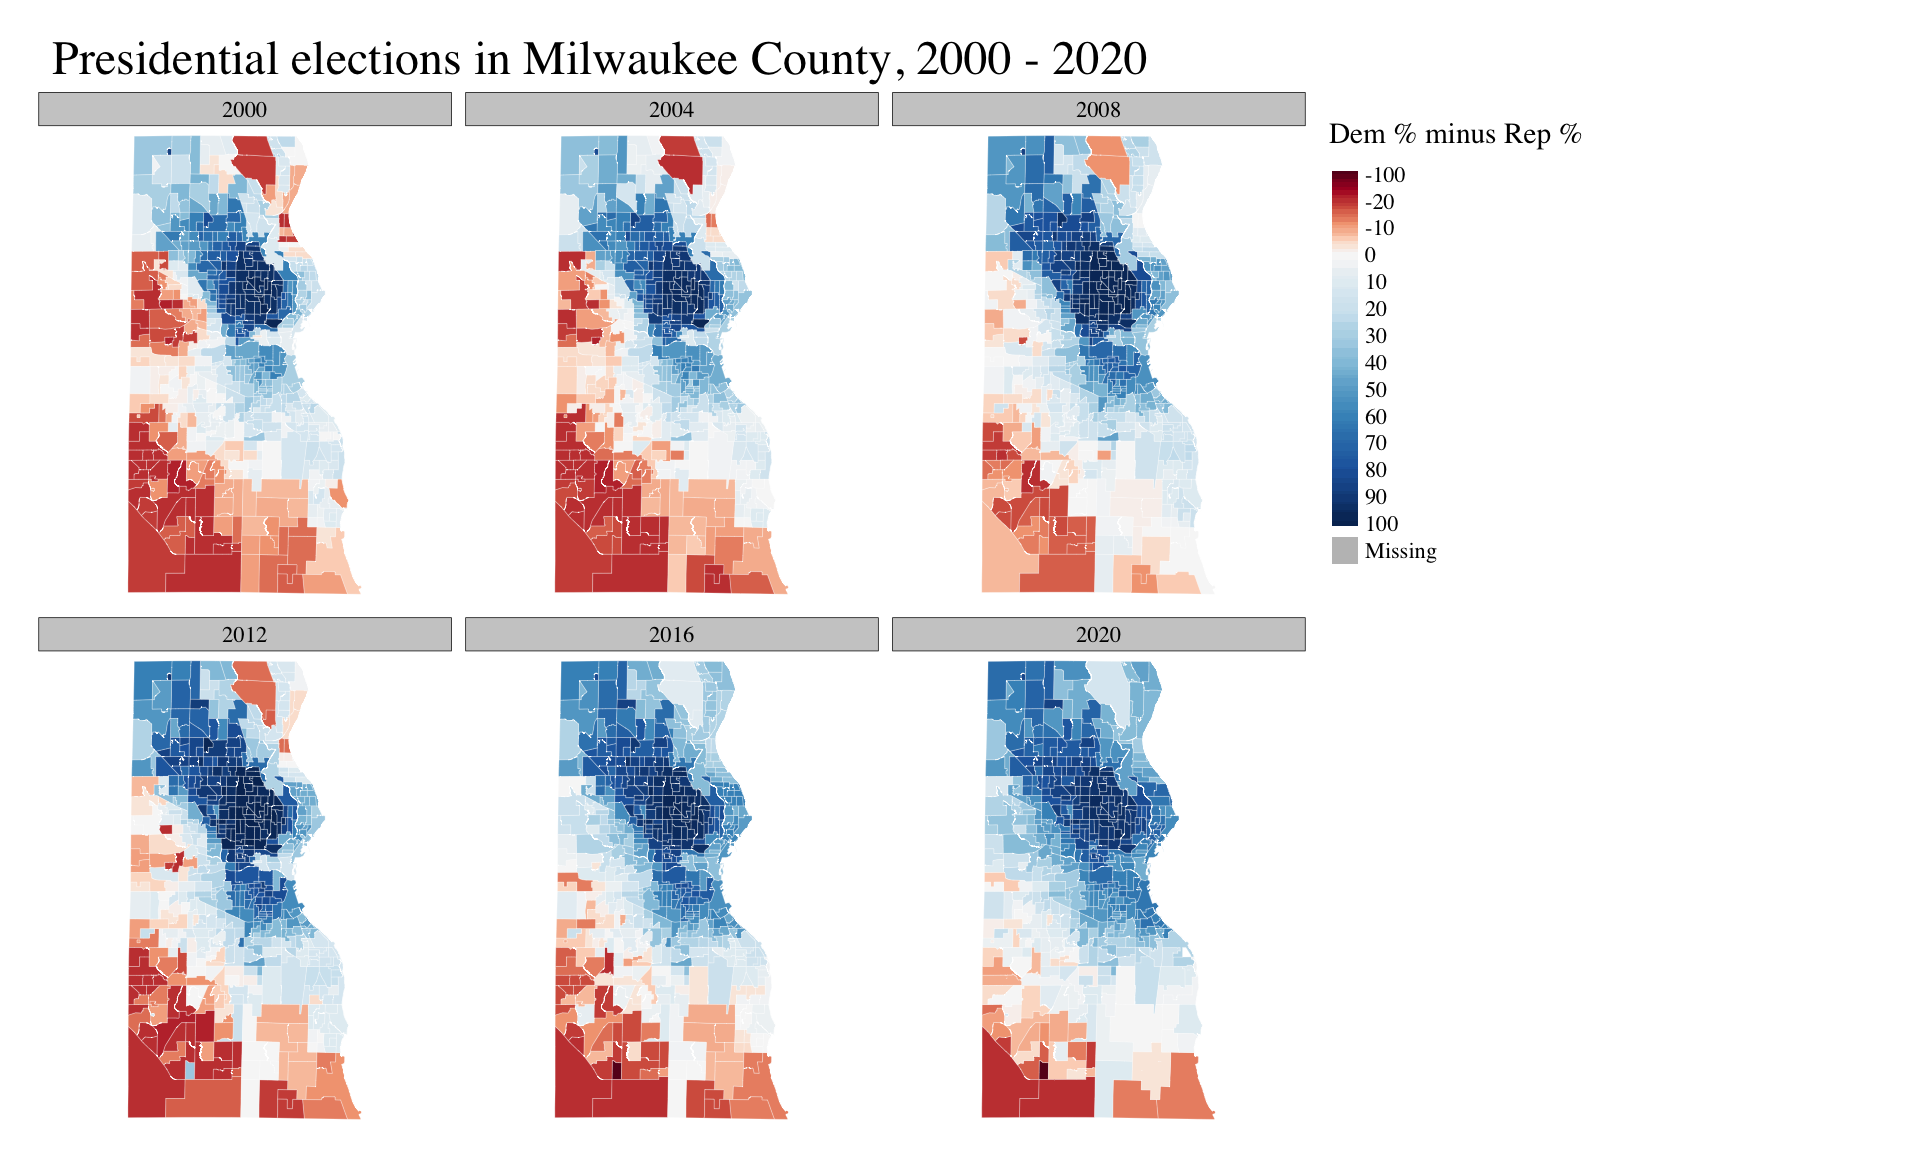 Data note: the 2000-2016 maps show votes by wards, disaggregated by the Wisconsin Legislative Technology Services Bureau. The 2020 map shows unofficial election results in reporting units.
The rest of this post will explore these trends in more detail. Use the map to explore some of the data yourself. You can toggle between the 2016 and 2020 results or the shift between them. Hover over each polygon to read vote statistics.
Data note: the suburbs often report their election results in combinations of wards called “reporting units.” The boundaries of these units do not necessarily stay the same from one election to another. For this reason, I present the results for each suburb as a single unit in these maps. The City of Milwaukee does not use reporting units, so I’m able to present ward results over time.
Turnout in the City of Milwaukee
The total number of ballots cast in the City of Milwaukee declined by 157 from 2016 to 2020. There were 16,840 fewer registered voters in Milwaukee on Election Day 2020 than on November 2, 2016 (the most comparable date for which I have data). Consequently, turnout as a share of registered voters rose from 74.6% in 2016 to 78.5% in 2020. However, turnout as a share of the adult, citizen population grew only two-tenths of a percent–from 61.0% to 61.2% (using the most recent population estimates). Several wards near college campuses saw big declines in registered voters and total ballots cast. This likely reflects the smaller number of students on campus this year.
This overall stability obscures the fact that significant changes did occur around the city. The total number of registered voters increased dramatically in downtown, Walker’s Point, and the Harbor District–no doubt reflecting population growth in that part of the city. Most wards on the north side of the city saw declines in the number of registered voters. The south side was a mixed bag.
While the number of registered voters declined on the north side, the proportion of registered voters actually casting a ballot increased in most places. By comparison, turnout rates declined across much of the south side.
Given Milwaukee’s recent population trends, it is plausible that the decline in registered voters (and ballots cast) in the north side reflects genuine population decline. However, the decline in ballots cast in the near south side suggests a decline in eligible voter participation.
Use the map below to toggle between changes in the share of registered voters casting a ballot, the shift in total number of ballots cast, and the shift in total registered voters.
Vote preferences in the City of Milwaukee
As already mentioned, the City of Milwaukee’s overall contribution to Wisconsin’s presidential election barely changed from 2016 to 2020. Clinton won 76.5% of the vote, compared to Biden’s 78.8% in 2020. But Donald Trump also increased his vote share from 18.4% to 19.6% Consequently, the Democrat’s margin of victory only increased marginally–from 58.1 points to 59.2.
Still, some parts of the city saw more change. The 3rd Aldermanic district, covering the east side and Riverwest shifted the most. Joe Biden’s margin of victory grew 10 points over Hillary Clinton’s 4 years earlier. The second largest shift came in the 12th district, on the near south side. Voters here shifted 8 points toward Donald Trump in 2020. Its western neighbor, the 8th district, shifted toward Trump by 7 points. The 15th district, covering parts of the near north and near west sides, shifted 5 points toward Trump.
Notable shifts in the Democratic direction also came in the 14th district (Bay View) and 5th district (northwest periphery), each of which shifted towards the Democrats by 7 points. The 4th district covering downtown and much of the near west side moved 6 points left, and the 10th district (Washington Heights, Enderis Park, the Zoo panhandle) shifted 5.
It can be easy to overinterpret these shifts. The 3rd district’s 10 point change means that Biden won with 82.5% of the vote compared to Clinton’s 74%. Trump got 15.4% in 2016, down from 17.2% in 2016. It appears Biden’s improvement came more at the expense of third parties than Trump.
In the 12th district, on the other hand, Trump improved from 13.4% in 2016 to 19.2% in 2020, an increase of 537 votes. Biden declined to 79.0%, down from Clinton’s 81.8% in 2016 and Obama’s 86.6% in 2012.
What explains Donald Trump’s slightly increased popularity on Milwaukee’s near south side? Much has already been written (“speculated” might be a better word) about Trump’s evidently improved popularity with Latino voters in other parts of the country. An alternative explanation for Milwaukee’s south side neighborhoods was suggested by Urban Milwaukee’s Jeramey Jannene. He wrote:
More examination is needed to determine if it’s a sign of a shift in the historic Hispanic and Latino support for Democrats and their policies, a dissatisfaction with Biden in particular or a sign that the white voters in the area, ones that repeatedly elected Robert Donovan, an avowedly pro-police alderman and Trump supporter, showed up in force to vote for Trump.
The data I’m using in this piece can’t definitively answer this question, but if Trump’s south side strength was due to the remaining influence of Milwaukee’s more conservative white ethnic communities I would also expect to see a similar pattern in the more predominantly non-Hispanic white south side neighborhoods of the 11th and 13th districts. Instead, we saw modest improvements for Joe Biden in these areas.
Both these things remain true. Majority non-white neighborhoods in the city of Milwaukee are among the strongest bastions of the Democratic party, not just in Milwaukee County, but Wisconsin as a whole. At the same time, some of these neighborhoods are also among the few places in Milwaukee County were Donald Trump had more appeal in 2020 than 2016.
| Presidential election results in Milwaukee Aldermanic districts, 2000 - 2020 | ||||||||||
|---|---|---|---|---|---|---|---|---|---|---|
| Aldermanic district | Demographic characteristics1 | Democratic presidential candidate vote margin2 | ||||||||
| White3 | Black3 | Hispanic | College | 20004 | 20044 | 20084 | 2012 | 2016 | 20205 | |
| 1 | 12% | 80% | 4% | 14% | 75 | 77 | 87 | 89 | 86 | 84 |
| 2 | 12% | 68% | 6% | 14% | 53 | 61 | 78 | 82 | 80 | 78 |
| 3 | 77% | 9% | 6% | 64% | 32 | 43 | 53 | 49 | 57 | 67 |
| 4 | 51% | 31% | 8% | 42% | 31 | 38 | 49 | 44 | 53 | 59 |
| 5 | 47% | 39% | 5% | 31% | 8 | 15 | 33 | 38 | 43 | 49 |
| 6 | 17% | 73% | 6% | 19% | 88 | 86 | 91 | 90 | 87 | 86 |
| 7 | 8% | 84% | 5% | 14% | 82 | 82 | 90 | 92 | 90 | 87 |
| 8 | 19% | 7% | 70% | 8% | 36 | 41 | 58 | 68 | 63 | 56 |
| 9 | 23% | 59% | 7% | 20% | 35 | 43 | 61 | 66 | 64 | 65 |
| 10 | 55% | 30% | 9% | 37% | 20 | 29 | 43 | 46 | 48 | 54 |
| 11 | 66% | 5% | 23% | 22% | 3 | 1 | 8 | 11 | 11 | 14 |
| 12 | 15% | 10% | 71% | 10% | 48 | 51 | 66 | 74 | 68 | 60 |
| 13 | 60% | 4% | 26% | 21% | 11 | 9 | 17 | 22 | 20 | 22 |
| 14 | 63% | 2% | 29% | 32% | 20 | 27 | 39 | 43 | 45 | 51 |
| 15 | 4% | 80% | 4% | 11% | 88 | 89 | 95 | 96 | 91 | 87 |
|
1
Estimates from the 2014-18 ACS, aggregated from block groups
2
the Democratic candidate's vote share minus the Republican candidates vote share
3
non-Hispanic or Latino
4
Calculated using disaggregated votes from the LTSB
5
unofficial returns
|
||||||||||
Vote preferences in the Milwaukee County suburbs
All 18 Milwaukee county suburbs shifted toward the Democratic presidential candidate in 2020. Double-digit margin shifts occured in Wauwatosa (+12), Fox Point (+11), Brown Deer (+10), and Hales Corners (+10). The smallest shifts came in West Milwaukee (+1), South Milwaukee (+2), and Cudahy (+3).
The gap between the southern suburbs and Milwaukee’s wealthier north shore suburbs is clear. Only three suburbs did not exceed their 2008 high water mark of support for the Democratic candidate. They are Cudahy, Oak Creek, and South Milwaukee. The rest gave Joe Biden a higher margin of victory than any Democratic candidate since at least 2000.
| Presidential election results in Milwaukee County suburbs, 2000 - 2020 | ||||||
|---|---|---|---|---|---|---|
| Democratic presidential candidate vote margin | ||||||
| 2000 | 2004 | 2008 | 2012 | 2016 | 20201 | |
| City of Cudahy | 10.4 | 9.4 | 15.3 | 14.4 | 6.4 | 9.7 |
| City of Franklin | −19.7 | −21.0 | −12.2 | −18.3 | −12.8 | −8.2 |
| City of Glendale | 13.9 | 16.3 | 27.4 | 24.7 | 37.2 | 45.4 |
| City of Greenfield | −3.9 | −6.3 | 1.4 | −3.3 | −2.7 | 4.4 |
| City of Oak Creek | −10.8 | −11.4 | −1.8 | −8.5 | −7.9 | −3.4 |
| City of South Milwaukee | 5.1 | 4.4 | 10.2 | 7.8 | 0.6 | 2.6 |
| City of St Francis | 11.2 | 7.8 | 14.6 | 12.8 | 13.3 | 20.0 |
| City of Wauwatosa | −15.6 | −8.0 | 6.2 | 1.4 | 21.9 | 34.1 |
| City of West Allis | −0.9 | −2.5 | 6.6 | 4.8 | 3.0 | 11.0 |
| Village of Bayside | 12.2 | 12.4 | 22.5 | 10.7 | 34.3 | 42.8 |
| Village of Brown Deer | 1.6 | 4.7 | 24.3 | 27.6 | 34.3 | 44.4 |
| Village of Fox Point | 2.8 | 6.1 | 13.8 | 6.0 | 30.3 | 41.4 |
| Village of Greendale | −16.5 | −17.0 | −7.9 | −11.3 | −3.8 | 2.9 |
| Village of Hales Corners | −22.2 | −23.9 | −15.8 | −19.9 | −15.1 | −5.0 |
| Village of River Hills | −17.4 | −15.0 | −7.0 | −15.7 | 7.9 | 14.3 |
| Village of Shorewood | 23.8 | 33.6 | 47.4 | 44.7 | 60.0 | 67.1 |
| Village of West Milwaukee | 11.6 | 14.1 | 30.3 | 27.9 | 33.9 | 34.7 |
| Village of Whitefish Bay | −9.2 | 0.5 | 12.8 | 4.5 | 33.0 | 41.8 |
|
1
unofficial returns
|
||||||
The 2020 presidential election was the most polarized in recent memory, yet as a consequence of the trends described above, the election in Milwaukee County was the least polarized in decades. It featured the smallest differences between Milwaukee’s aldermanic districts and the smallest difference between the central city and the inner-ring suburbs of any election in the past 20 years.