How church attendance affects Trump support
Churchgoing Wisconsinites are more likely to approve of Trump’s job performance than their less observant peers. Although some individual steps are within the margin of error1, the trend is monotonic. People who go to church more than once a week approve of Trump more than those who go only weekly; they in turn support Trump more than people who only go once or twice a month, and so on.
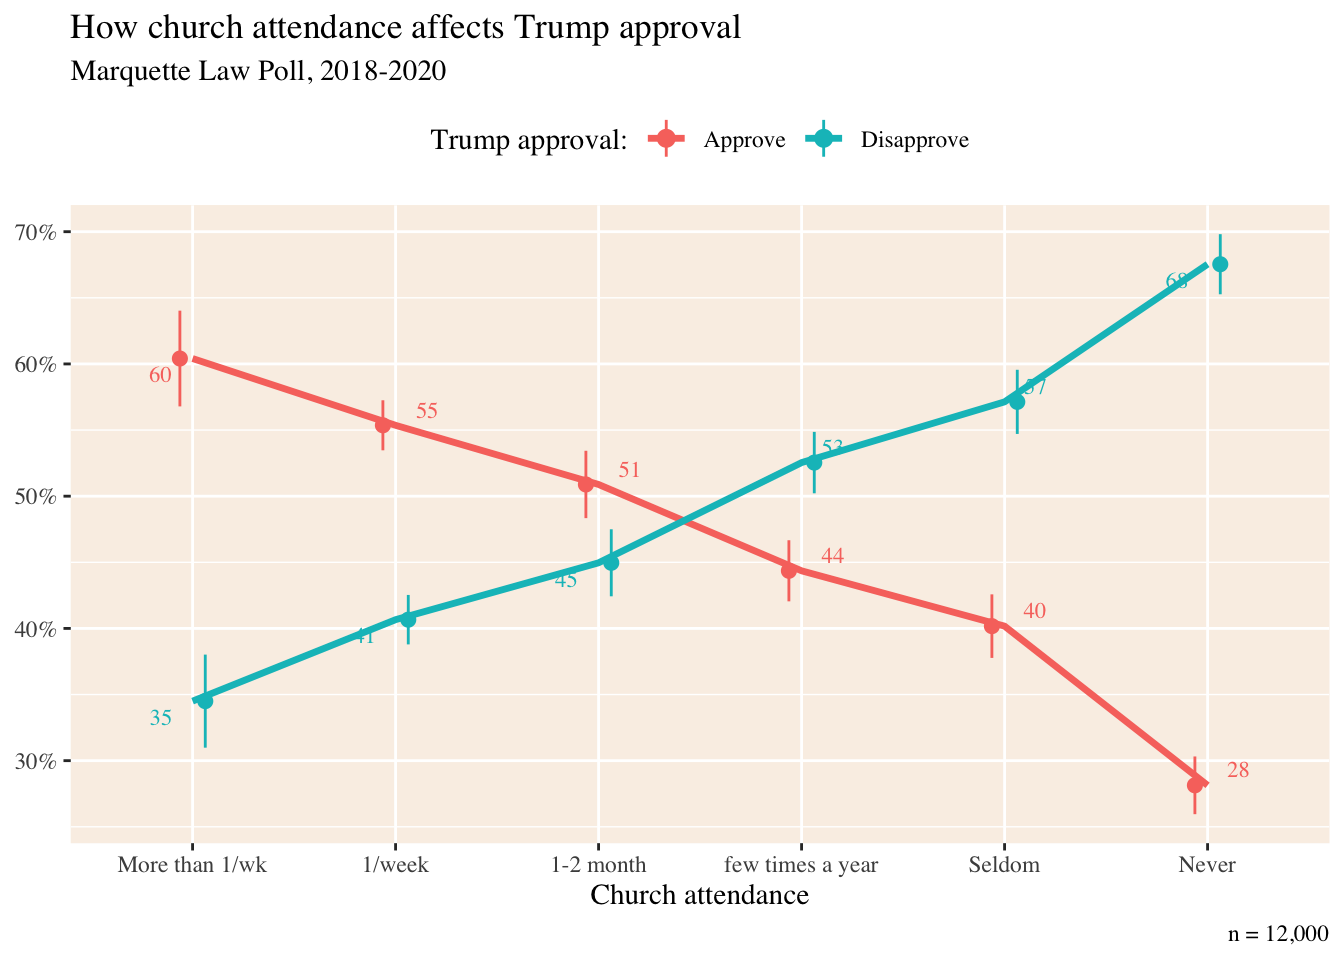
Wisconsin registered voters who go to church at least once a month are 12% more likely to strongly approve of Trump’s job performance than those who don’t. These regular churchgoers are 18% less likely to say they strongly disapprove of Trump.
This in itself probably won’t surprise anyone. After all, Trump’s support is famously concentrated among evangelical Christians who have very high levels of church attendance.2 Three-fourths of self-described “born-again or evangelical” Christians report attending at least once a month, compared with 55% of Catholics and 48% of Mainline Protestants.
But church attendance correlates with greater support for Trump (or less disapproval, at least) among all three of these groups. In fact, Trump support increases in a statistically significant way even for the tiny faction of non-religious people who attend church regularly.3
To measure this question, I combined all 14 Marquette University Law School Polls fielded from January 2018 to January 2020, and I recoded church attendance into two categories–people who report going to church once a month or more and people who attend church only a few times a year, seldom, or never.4 Using this large pool of responses, I compared the relationship between church attendance and Trump approval among each of these religious groups: Born-again or evangelical Christians, Mainline Protestants, Roman Catholics, and those professing no religion. Respectively, these represent 18%, 25%, 28%, and 17% of Wisconsin’s registered voters.
Here are the results. The vertical lines around each dot show the 95% confidence interval. For example, 47% of born again Protestants who go to church at least monthly strongly approve of Trump’s job performance. Fewer (42%) of less-frequent evangelical attenders strongly approve of Trump, but this difference is not statistically significant.
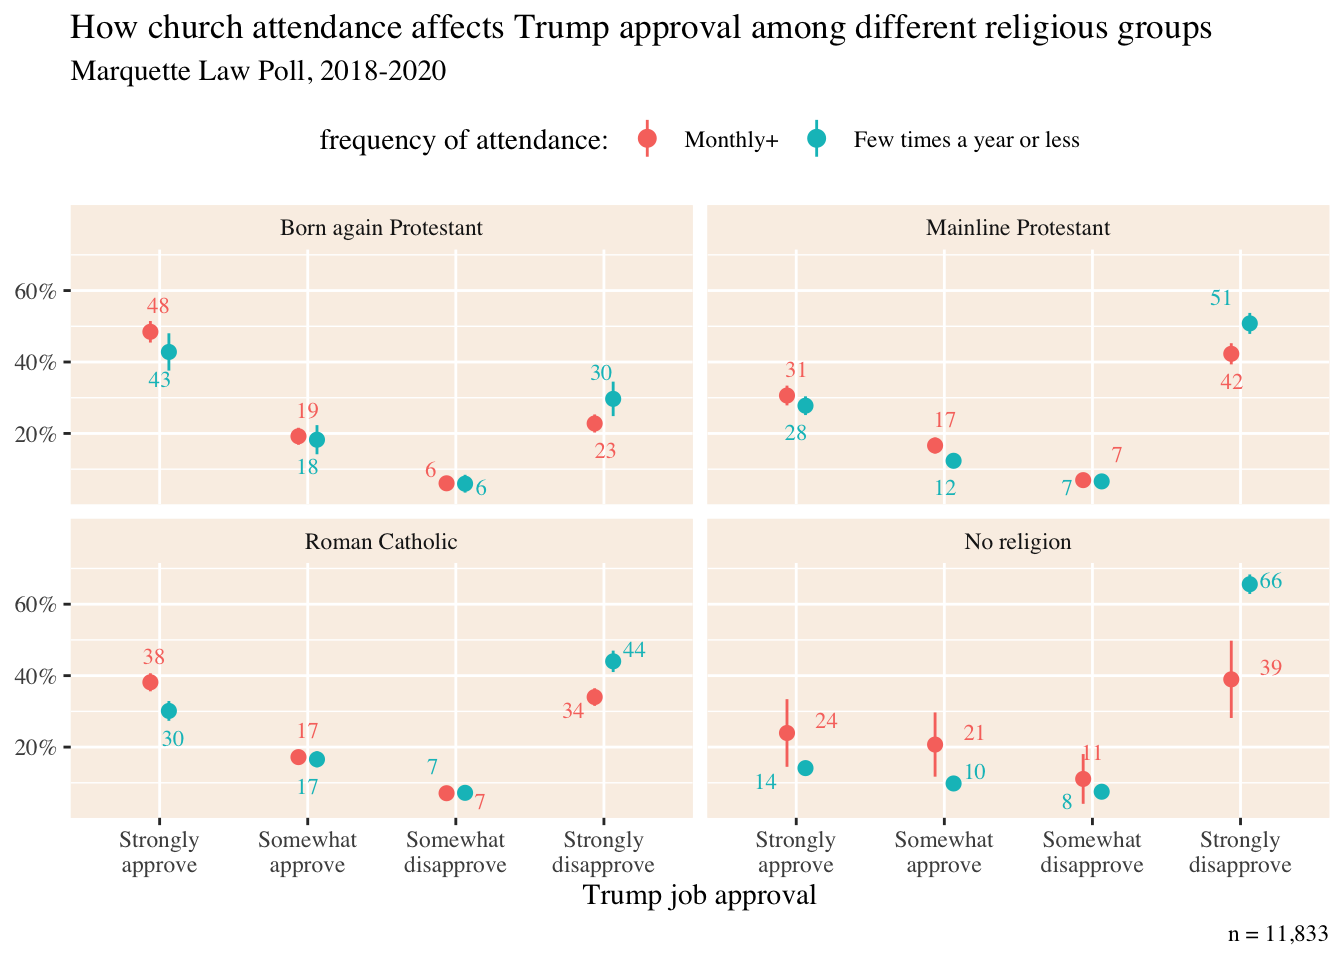
Here are the statistically significant results.
- Evangelicals who go to church less than once a month are more likely to strongly disapprove of Trump than their more regularly attending counterparts. Difference: 8%.
- Mainline Protestants who go to church regularly are more likely (+5%) to somewhat approve of Trump and less likely (-10%) to strongly disapprove of Trump than Mainliners who don’t go to church much.
- Churchgoing Catholics are more likely to strongly approve of Trump (+8%) and less likely to strongly disapprove of him (-11%) than less-attending Catholics.
- Non-religious people who still go to church regularly are more likely to somewhat approve of Trump (+12%) and less likely to strongly disapprove of him (-25%) than non-religious people who avoid church.
What about partisanship?
Maybe churchgoers of all these different orientations are just more likely to be Republicans. To test this, I ran the regression model below. The base category is self-described Independents who go to church less than once a month, if at all. The independent variable, partyID3, is coded -1 for Republicans, 0 for Independents, and 1 for Democrats. ChurchAttend is coded 1 if people attend church at least once a month.
According to this model, we expect 43% of Independents who don’t go to church to approve of Trump. Going to church at least once per month correlates with a 7% increase in Trump approval, regardless of party ID.
| Dependent variable: | |
| TrumpApprove | |
| ChurchAttend | 0.064*** |
| (0.007) | |
| partyID3 | -0.423*** |
| (0.004) | |
| Constant | 0.439*** |
| (0.004) | |
| Observations | 13,080 |
| R2 | 0.452 |
| Adjusted R2 | 0.451 |
| Residual Std. Error | 0.369 (df = 13077) |
| F Statistic | 5,383.467*** (df = 2; 13077) |
| Note: | p<0.1; p<0.05; p<0.01 |
All statistics are for registered voters. All statistics discussed are statistically significant with 95% confidence unless otherwise noted.↩
We define “evangelicals” as those who answer yes to “Would you describe yourself as a ‘born-again’ or evangelical Christian, or not?” We do not ask Roman Catholics or non-Christians this question.↩
Six percent of people who say they have “no religion” still claim to go to church at least once a month.↩
Trump’s approval rating was very stable during this period, never climbing above 48% or falling below 42%.↩