Some graphs about wages
The following graphs explore wages at different levels of education in the United States. It’s important to understand that these are not depicting income for all people holding these degrees. Instead, they are showing the wages (or salaries) earned by people who work full time.1 People who only work part time or who don’t work at all are excluded as well as people who aren’t paid for their work.2 I’m also leaving out income from sources besides work.
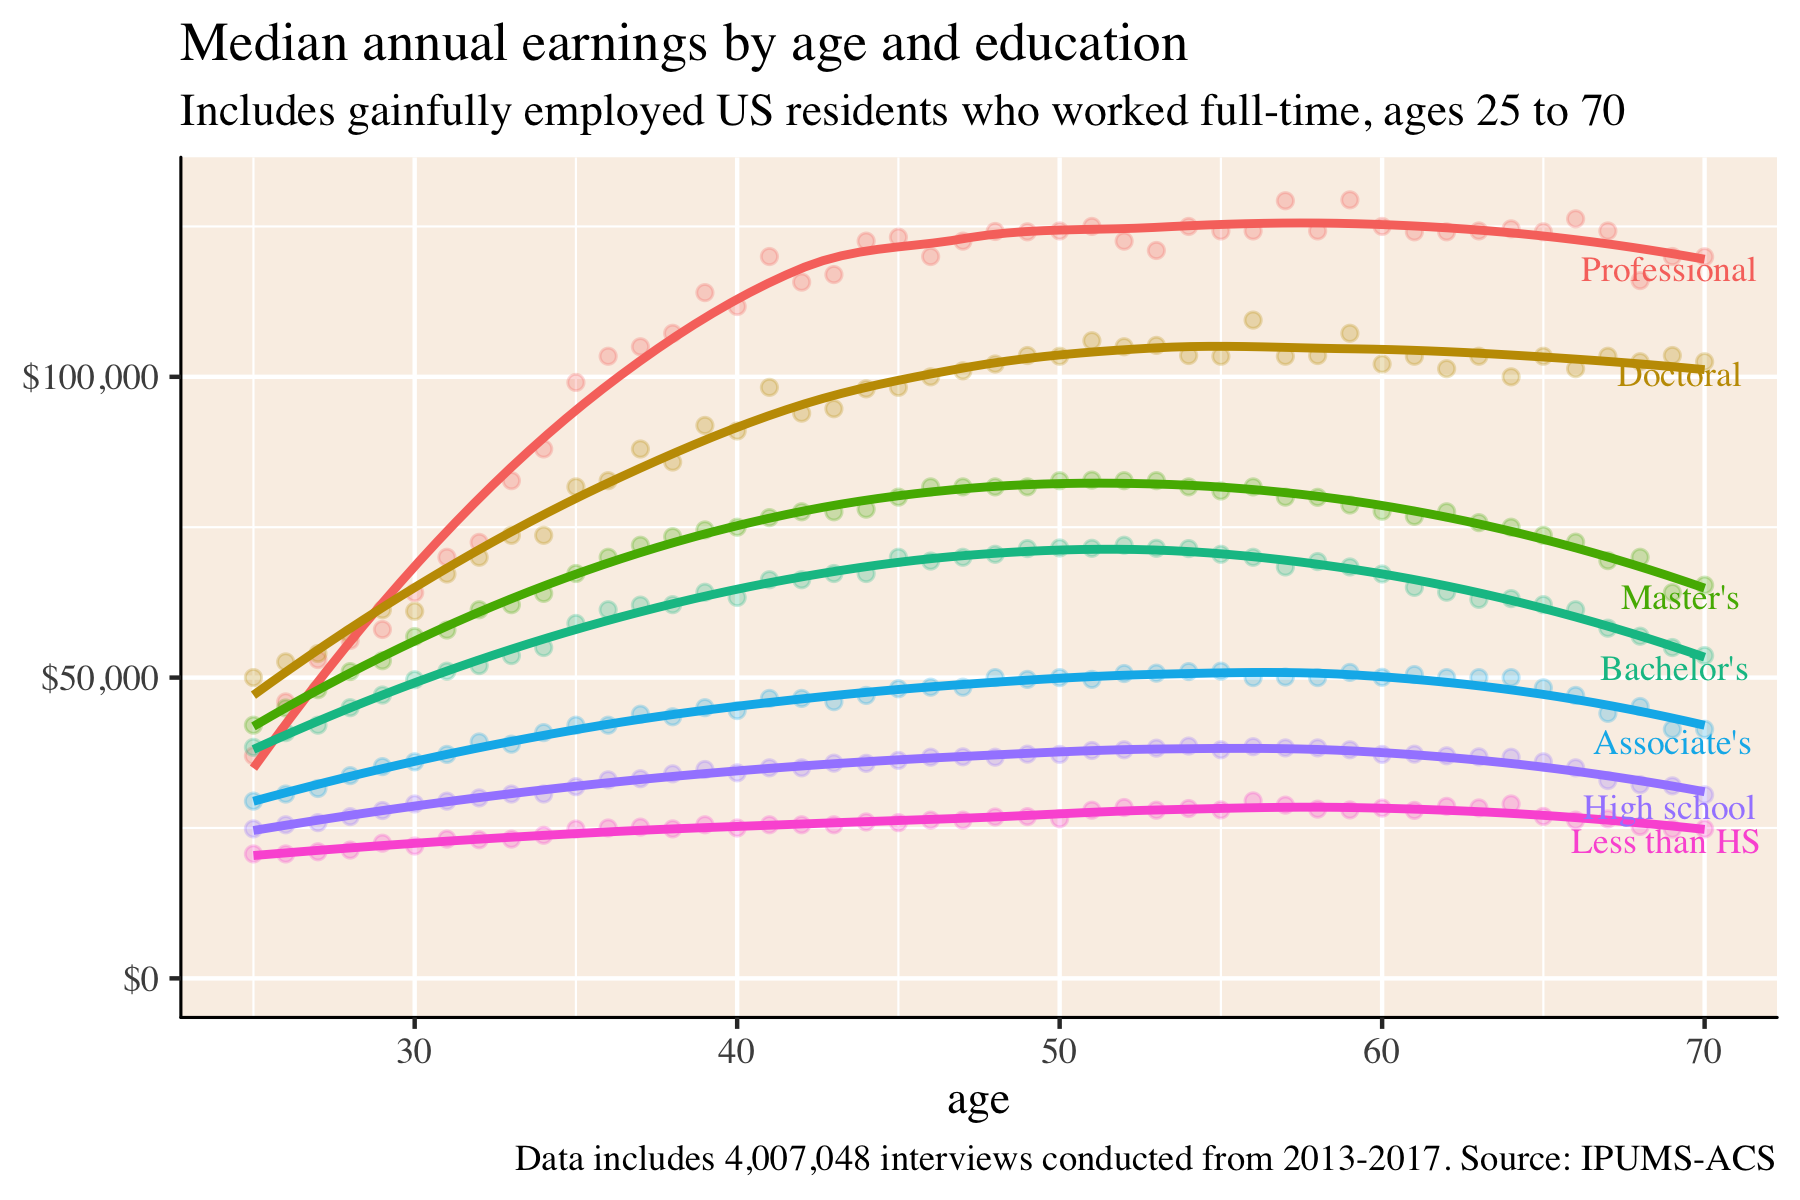
Education affects earnings a lot, and the magnitude increases with age. This first graph simply shows the median earnings for people with different degrees at each year of their life from age 25 to 70.
At age 25, a high school graduate makes $4,200 more than someone without that diploma. An Associate’s degree holder brings home $4,600 more than the high school grad. Having a bachelor’s degree earns $8,900 over the 2-year degree. A Master’s tacks on $3,700 more than an BA. The doctoral degree improves over the MA by $7,900. The 25 year-old holder of a professional degree is just starting their career and can actually expect to earn slightly less than someone with just a Bachelor’s, but this will change very quickly.
With the exception of professional degree holders, the relative ranks of all these degree holders will be unchanged at age 55, but the differences between their wages will have skyrocketed. A worker without a high school diploma (or eqivalent) will earn just $28,000. The HS graduate will make $38,000. The Associate’s degree holder will have just about reached the level of a 25 year-old doctor, earning $51,000 a year. The median college Bachelor will make $70,500. The Master’s degree holder draws $81,000; the Doctor $103,400; and the Professional $124,300.
The numbers in the graph above are just median values. Most people make either more or less than that number–sometimes by a considerable amount. The next two graphs show the distribution of earnings for people with a high school degree, a BA, and a doctorate in each state.3 The first graph shows early-career earners (ages 25-35), while the second shows mid-career salaries (ages 40-54). In each graph, the labelled dots show median values.
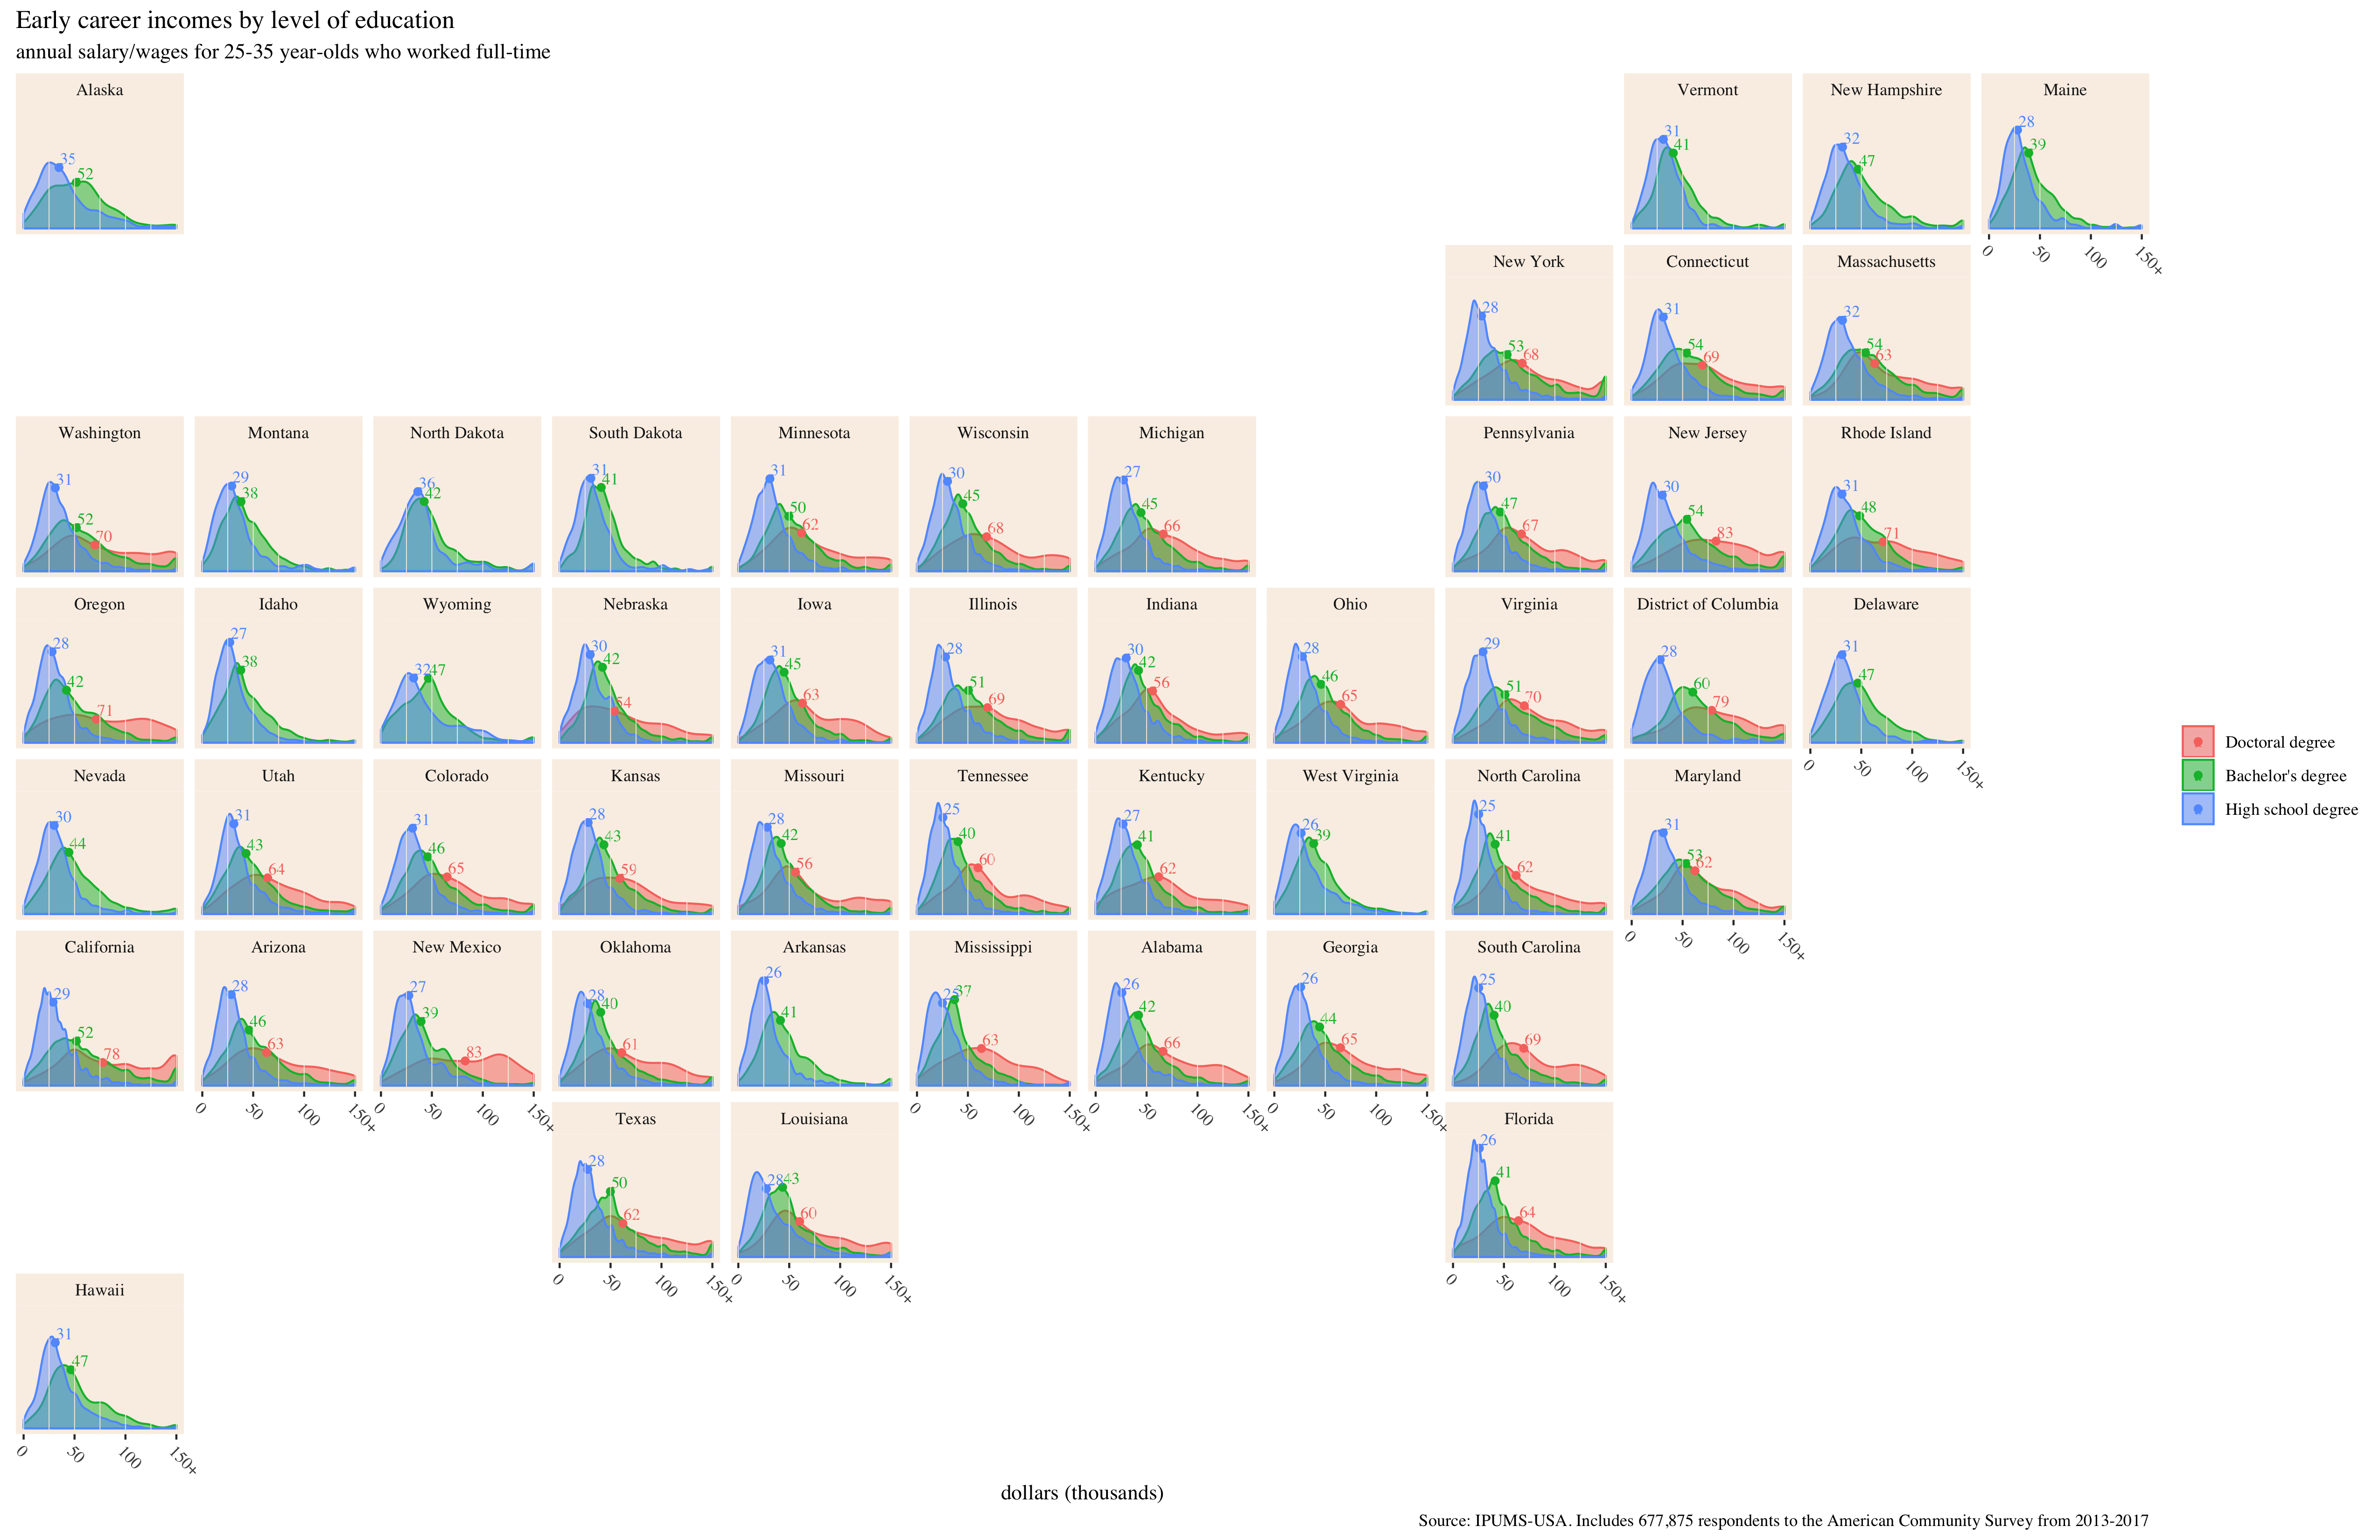
Early-career high school degree holders make the least, on average, in Mississippi where the median income is $25,000. They make the most in North Dakota, where the median income is $34,700. Bachelor’s degree holders also make the least in Mississippi ($36,800); they earn the most in the District of Columbia ($61,300). Among states where an estimate was possible, holders of a doctorate made the least in Indiana ($56,900) and the most in New Jersey ($84,000).
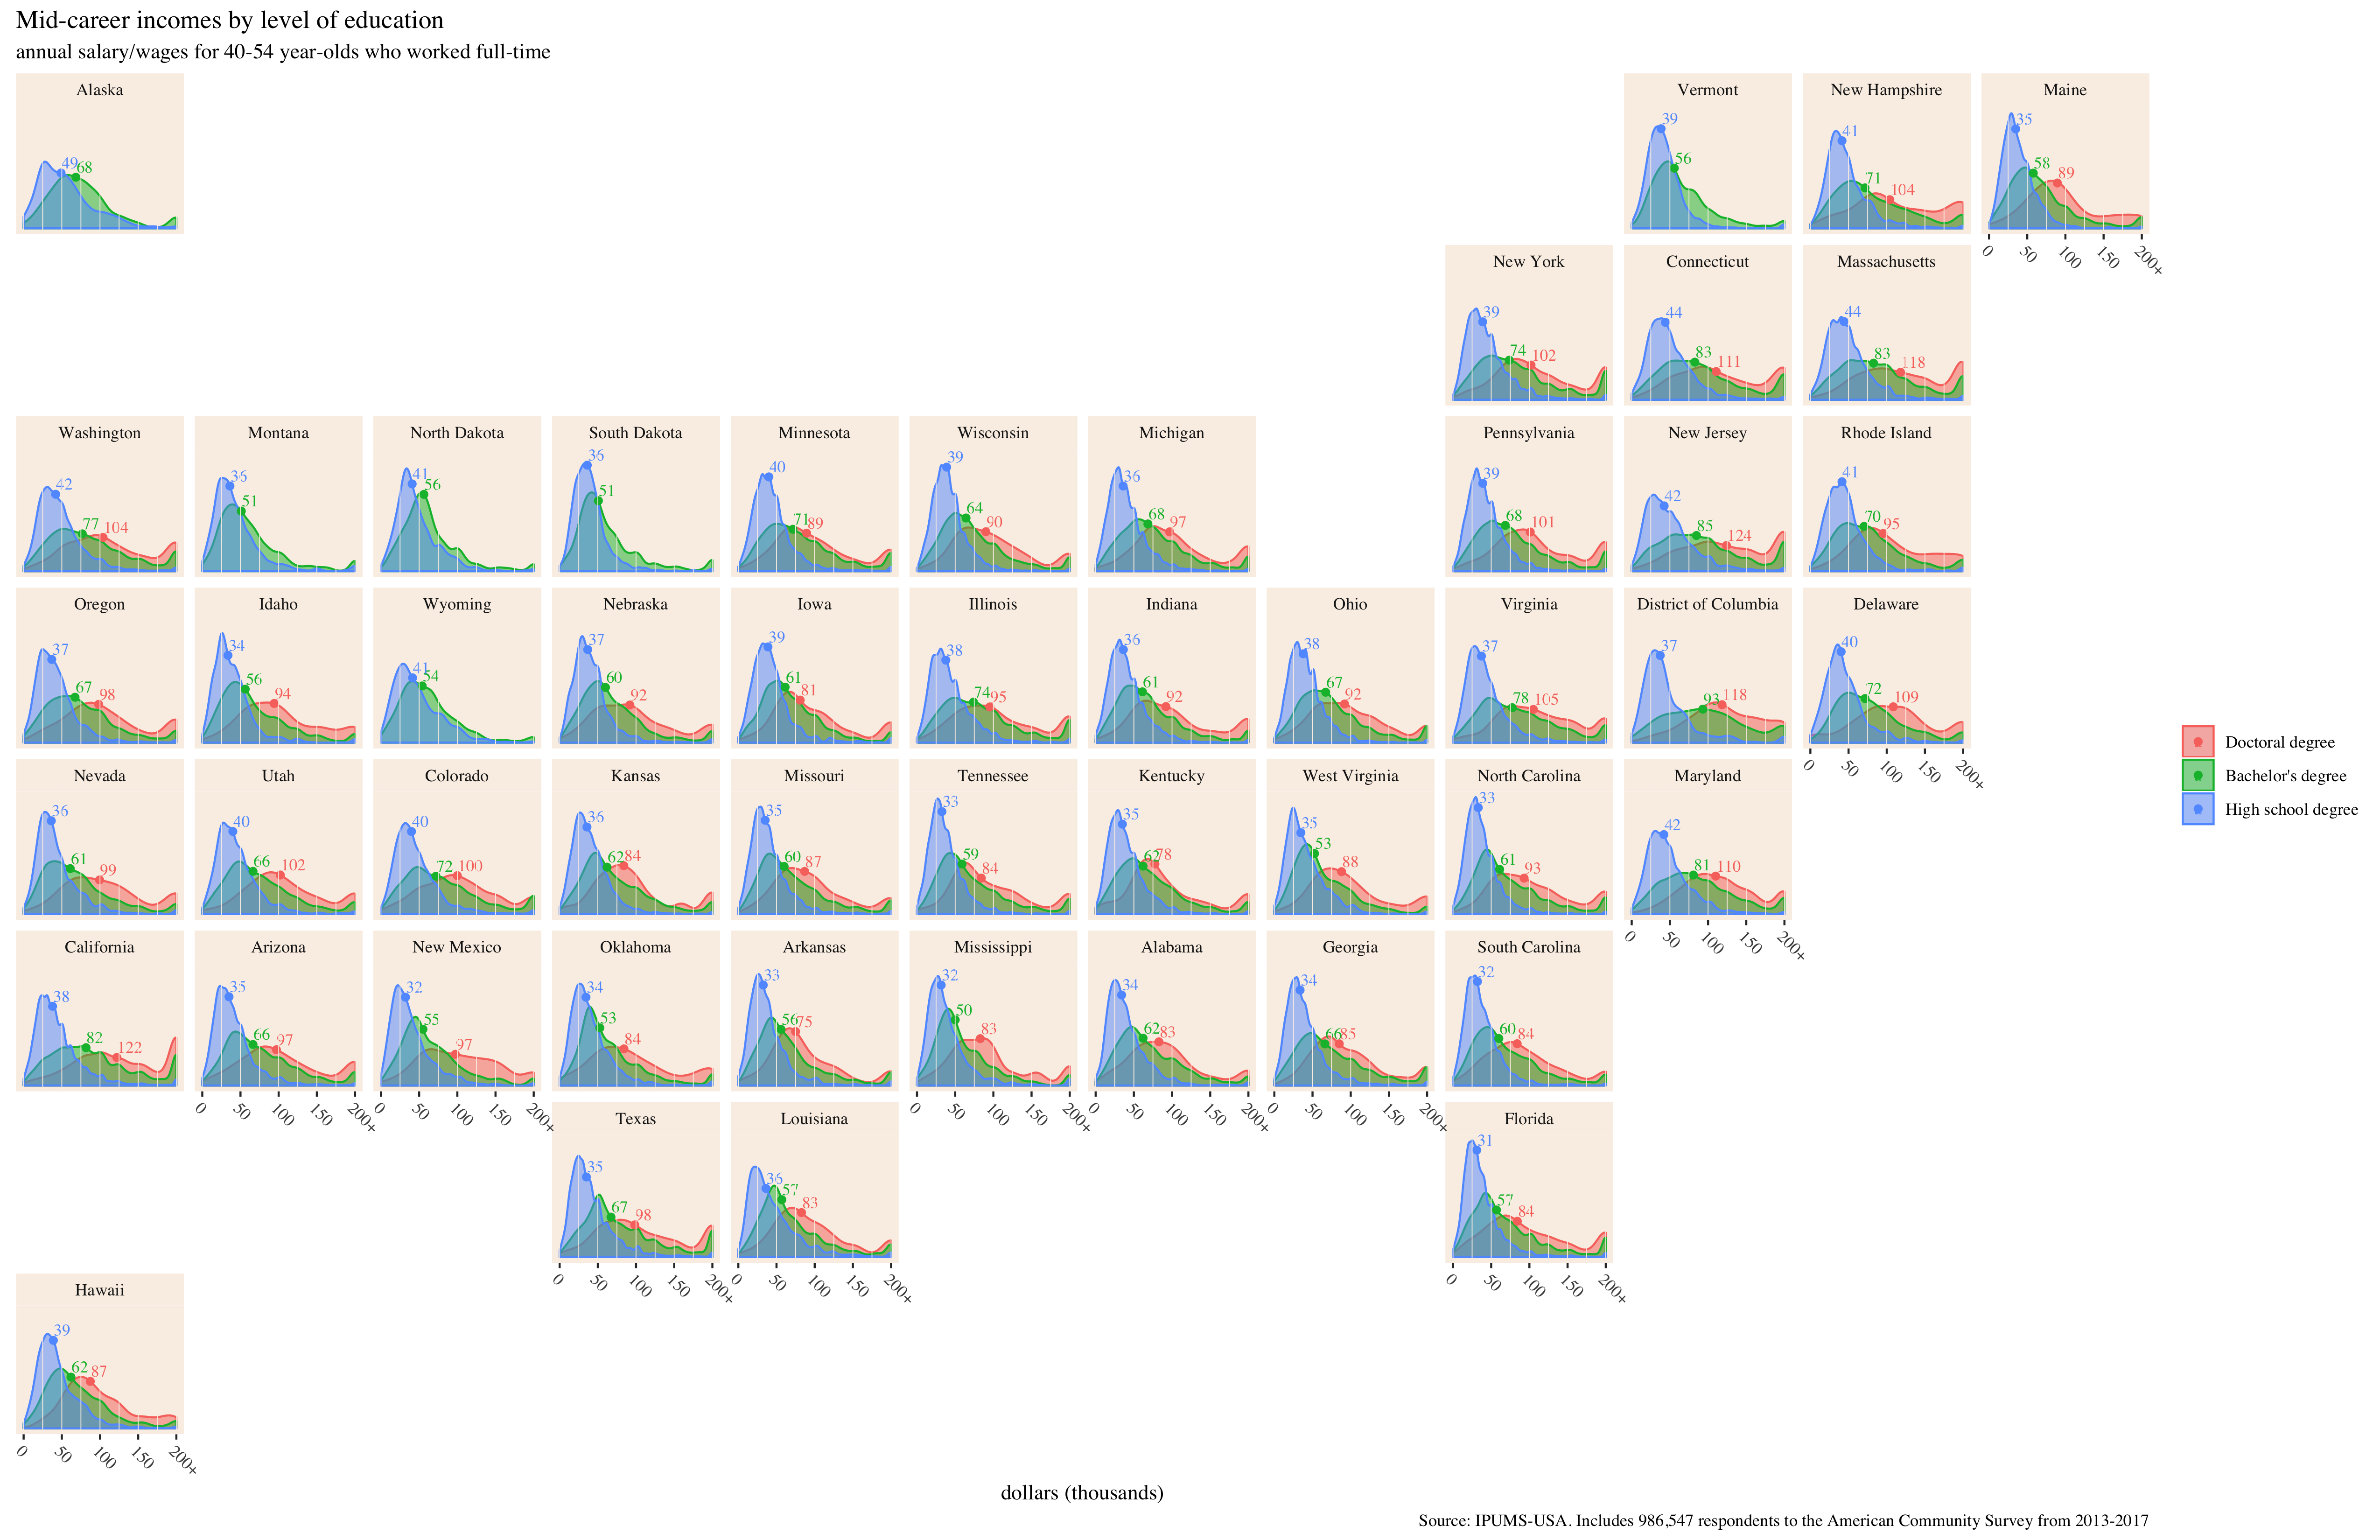
Mississippi is still the worst for mid-career high school degree holders. The average worker will earn just $31,600. New Jersey and Connecticut (not North Dakota) tie for the best at $46,000. Among those with a Bachelor’s, South Dakota ($49,000) edges out Mississippi ($50,000) for the bottom spot. The District of Columbia retains its hold on first place with a median mid-career salary of $100,000. Mid-career doctorate degree holders make the least in Kentucky ($74,600) and the most in D.C. ($123,000).
Notes on data
All this data is taken from the 2013-2017 5-year American Community Survey, conducted by the Census Bureau. All monetary values are in 2017 real dollars. The data was obtained from IPUMS-USA:
Steven Ruggles, Sarah Flood, Ronald Goeken, Josiah Grover, Erin Meyer, Jose Pacas and Matthew Sobek. IPUMS USA: Version 9.0 [dataset]. Minneapolis, MN: IPUMS, 2019. https://doi.org/10.18128/D010.V9.0
The visualizations were made in R using:
H. Wickham. ggplot2: Elegant Graphics for Data Analysis. Springer-Verlag New York, 2016.
Ryan Hafen (2019). geofacet: ‘ggplot2’ Faceting Utilities for Geographical Data. R package version 0.1.10. https://CRAN.R-project.org/package=geofacet
Following the Affordable Care Act, I define “full-time employment” as at least 30 hours per week. I choose not to normalize wages and salaries by hours worked because I think the number of hours worked (among workers who have already achieved full-time employment) reflects a variety of complicated factors including hours available, lifestyle choices, and industry expectations.↩
Some people report themselves as working many hours per week but receiving no income. This could be because they are self-employed or work for a family business without drawing a salary.↩
I’ve ommitted degree-state pairs with fewer than 100 observations. Most have many, many more cases than that.↩