Mapping the Urban-Rural Continuum
Modified RUCA codes that distinguish between cities and suburbs
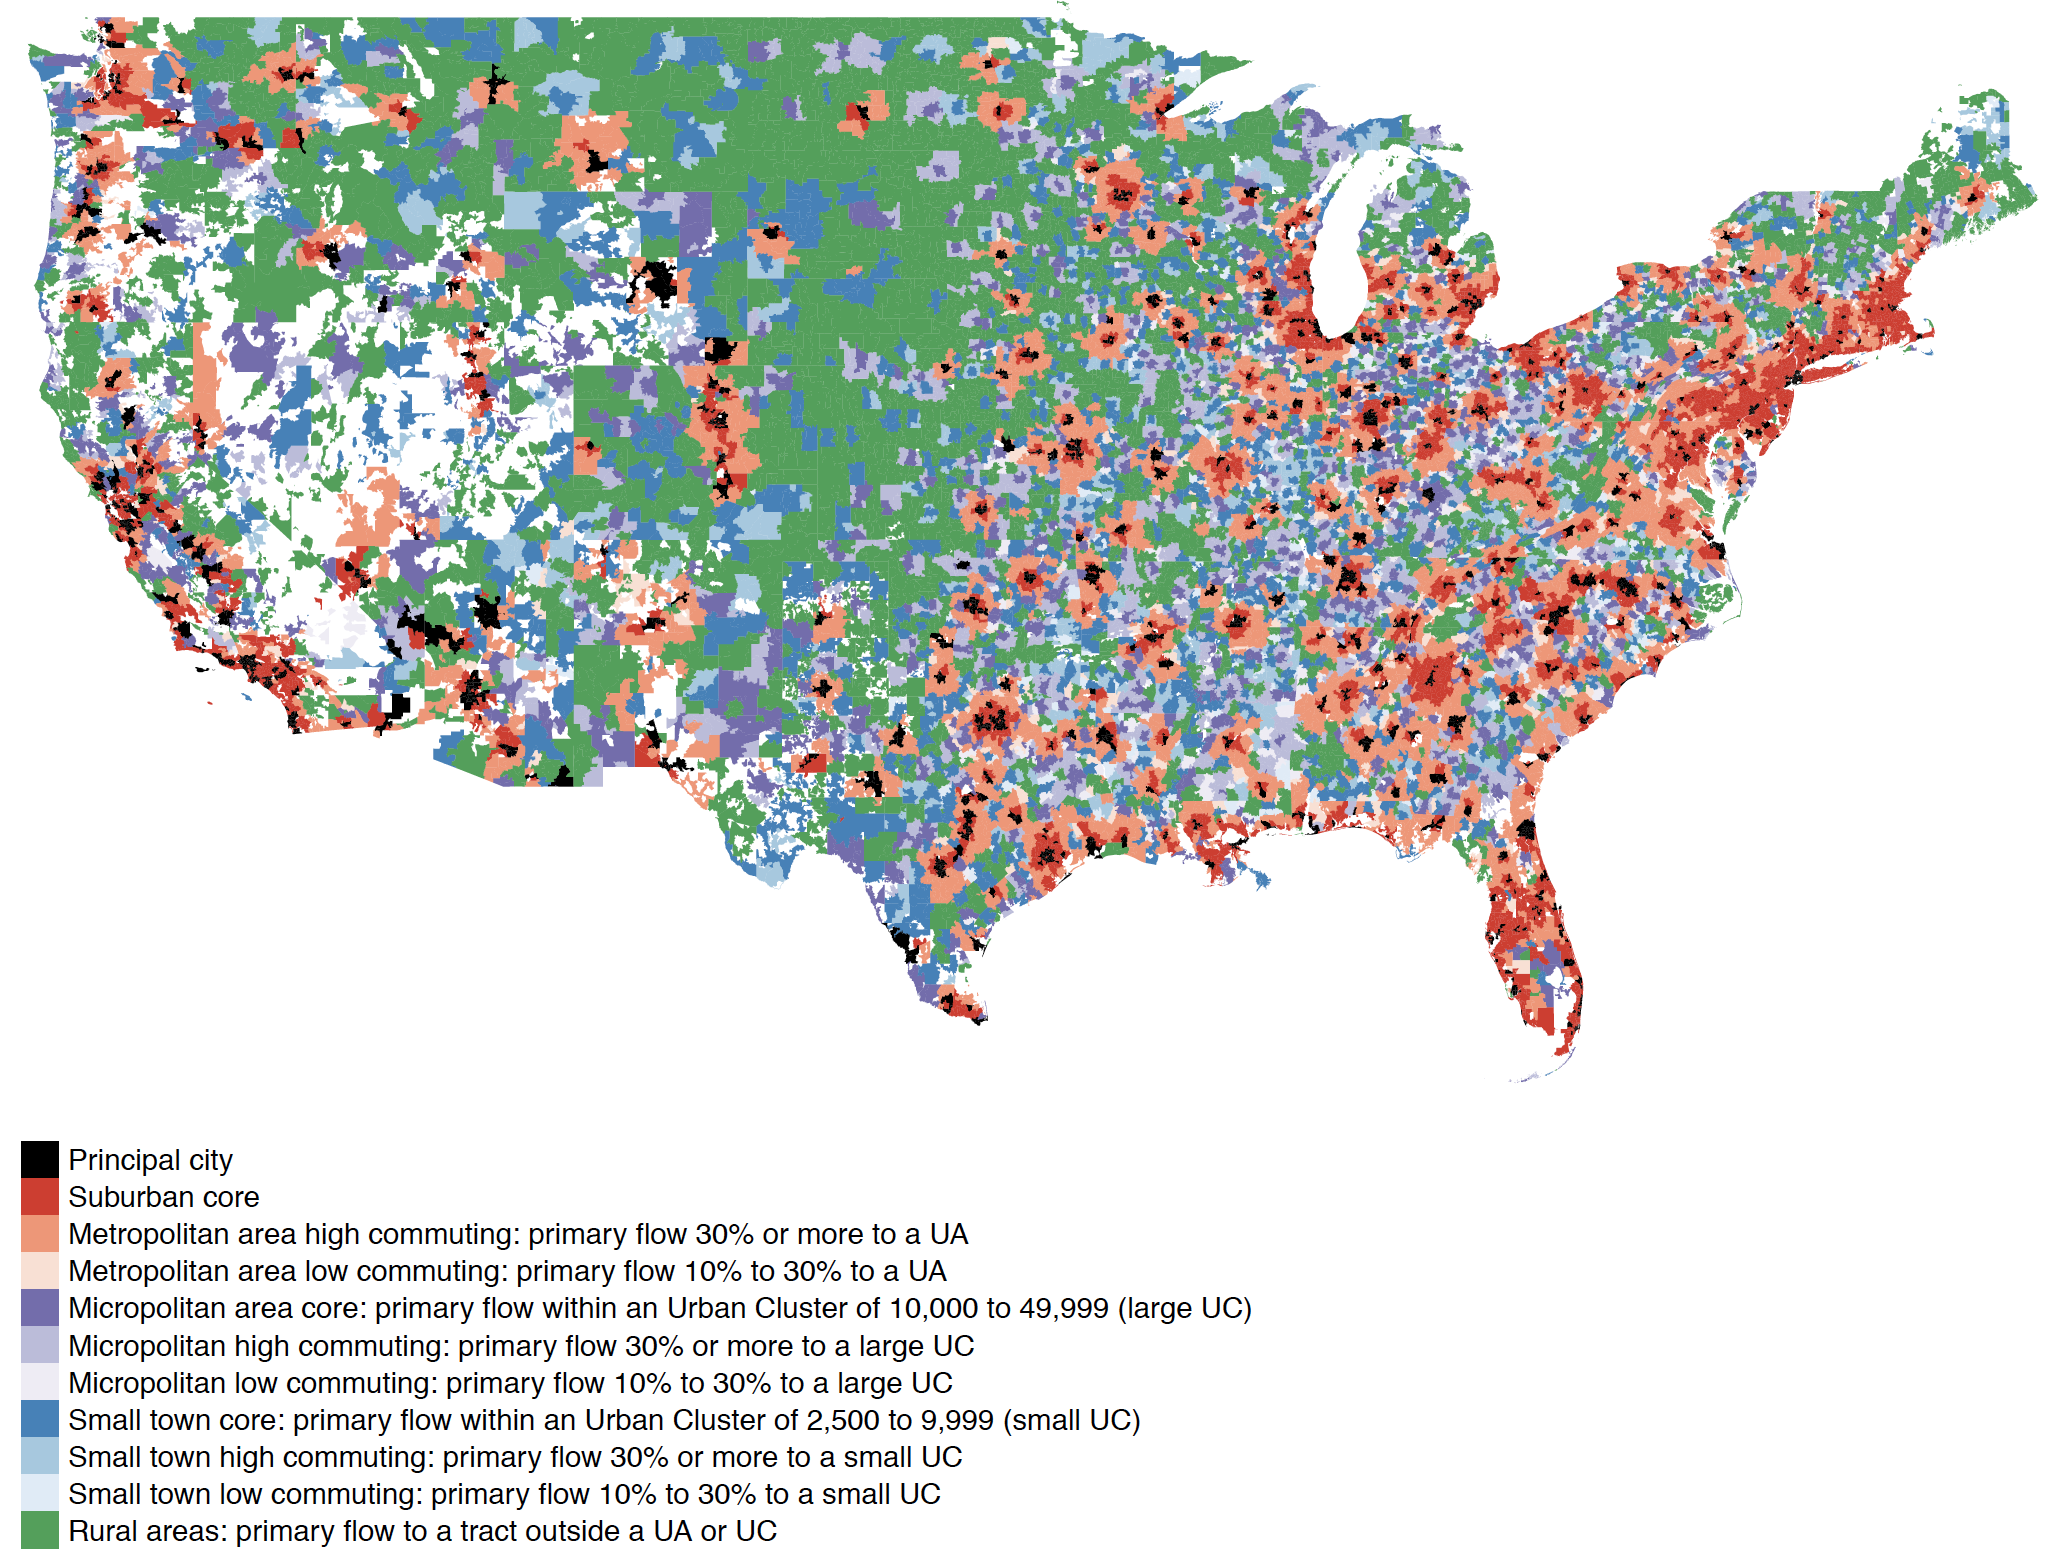
Rural-Urban Commuting Area Codes (RUCA) are created by the USDA to “classify U.S. census tracts using measures of population density, urbanization, and daily commuting.” The USDA also provides a zip code-based RUCA file. These are particularly useful for public opinion researchers who know an interview respondent’s zipcode but possibly little other geographic information.
The basic RUCA codes use a single code for urbanized areas–a broad Census Bureau designation which includes basically all the built-up parts of a Metropolitan Statistical Area. Public opinion researchers typically want to distinguish between “urban” and “suburban” communities, both of which are included in the Census definition of “urbanized areas” and thus also RUCA code #1.
To solve this problem, I create an additional code for “principal cities.” Using the Missouri Census Data Center’s Geographic Correspondence Engine, I created a population-weighted crosswalk between 2010 ZCTAs (zip codes) and 2014 places. I then identify the census-designated principal cities of metropolitan statistical areas (as of 2020). I exclude the principal cities of micropolitan statistical areas.
A zip code is classified as a “principal city zip” if a majority of the population resides in a principal city.
The resulting zipcode-to-modified-RUCA file is available to download at this link (right-click and choose “save link as”). The zipcode to principal cities crosswalk is available in the source-data folder of this repository.
The modified RUCA file also includes additional suggested summary classifications combining multiple existing codes.
Here is a table showing the codes along with the number of zipcodes and total national population.
| ruca_new | label_new | ruca6 | ruca5 | zips | population |
|---|---|---|---|---|---|
| 0 | Principal city | Principal city | Principal city | 3,914 | 109,596,588 |
| 1 | Suburban core | Suburban core | Suburban core | 12,671 | 133,895,135 |
| 2 | Metropolitan area high commuting: primary flow 30% or more to a UA | Exurbs | Exurbs | 7,026 | 25,928,062 |
| 3 | Metropolitan area low commuting: primary flow 10% to 30% to a UA | Exurbs | Exurbs | 897 | 2,142,882 |
| 4 | Micropolitan area core: primary flow within an Urban Cluster of 10,000 to 49,999 (large UC) | Large towns (10-50k) | Large towns (10-50k) | 2,182 | 21,906,755 |
| 5 | Micropolitan high commuting: primary flow 30% or more to a large UC | Large towns (10-50k) | Large towns (10-50k) | 2,788 | 5,184,196 |
| 6 | Micropolitan low commuting: primary flow 10% to 30% to a large UC | Large towns (10-50k) | Large towns (10-50k) | 636 | 1,113,485 |
| 7 | Small town core: primary flow within an Urban Cluster of 2,500 to 9,999 (small UC) | Small towns (2.5-10k) | Rural (less than 10k | 2,039 | 11,226,057 |
| 8 | Small town high commuting: primary flow 30% or more to a small UC | Small towns (2.5-10k) | Rural (less than 10k | 1,378 | 1,933,200 |
| 9 | Small town low commuting: primary flow 10% to 30% to a small UC | Small towns (2.5-10k) | Rural (less than 10k | 538 | 816,103 |
| 10 | Rural areas: primary flow to a tract outside a UA or UC | Isolated rural | Rural (less than 10k | 6,899 | 9,124,824 |
Application examples
For example uses of these RUCA codes see:
“The suburbs constituted the base of the GOP in Wisconsin for years. Now they’re up for grabs,” Craig Gilbert, Milwaukee Journal Sentinel, 24 October 2020.
“Why Trump is Losing White Suburban Women,” Meredith Conroy, Amelia Thomson-DeVeaux, and Erin Cassese, FiveThirtyEight.com, 20 October 2020.
Build your own modified RUCA crosstabs using Wisconsin polling data from the Marquette Law School Poll.