Barrett’s Electoral History
And what it tells us about Milwaukee’s changing electorate
Beginning with the 2004 spring mayoral primary, Milwaukee voters had the opportunity to vote for Tom Barrett or somebody else nine times.1 The maps below show (1) the wards which voted for Barrett in any of those elections and (2) the wards which Barrett always won.
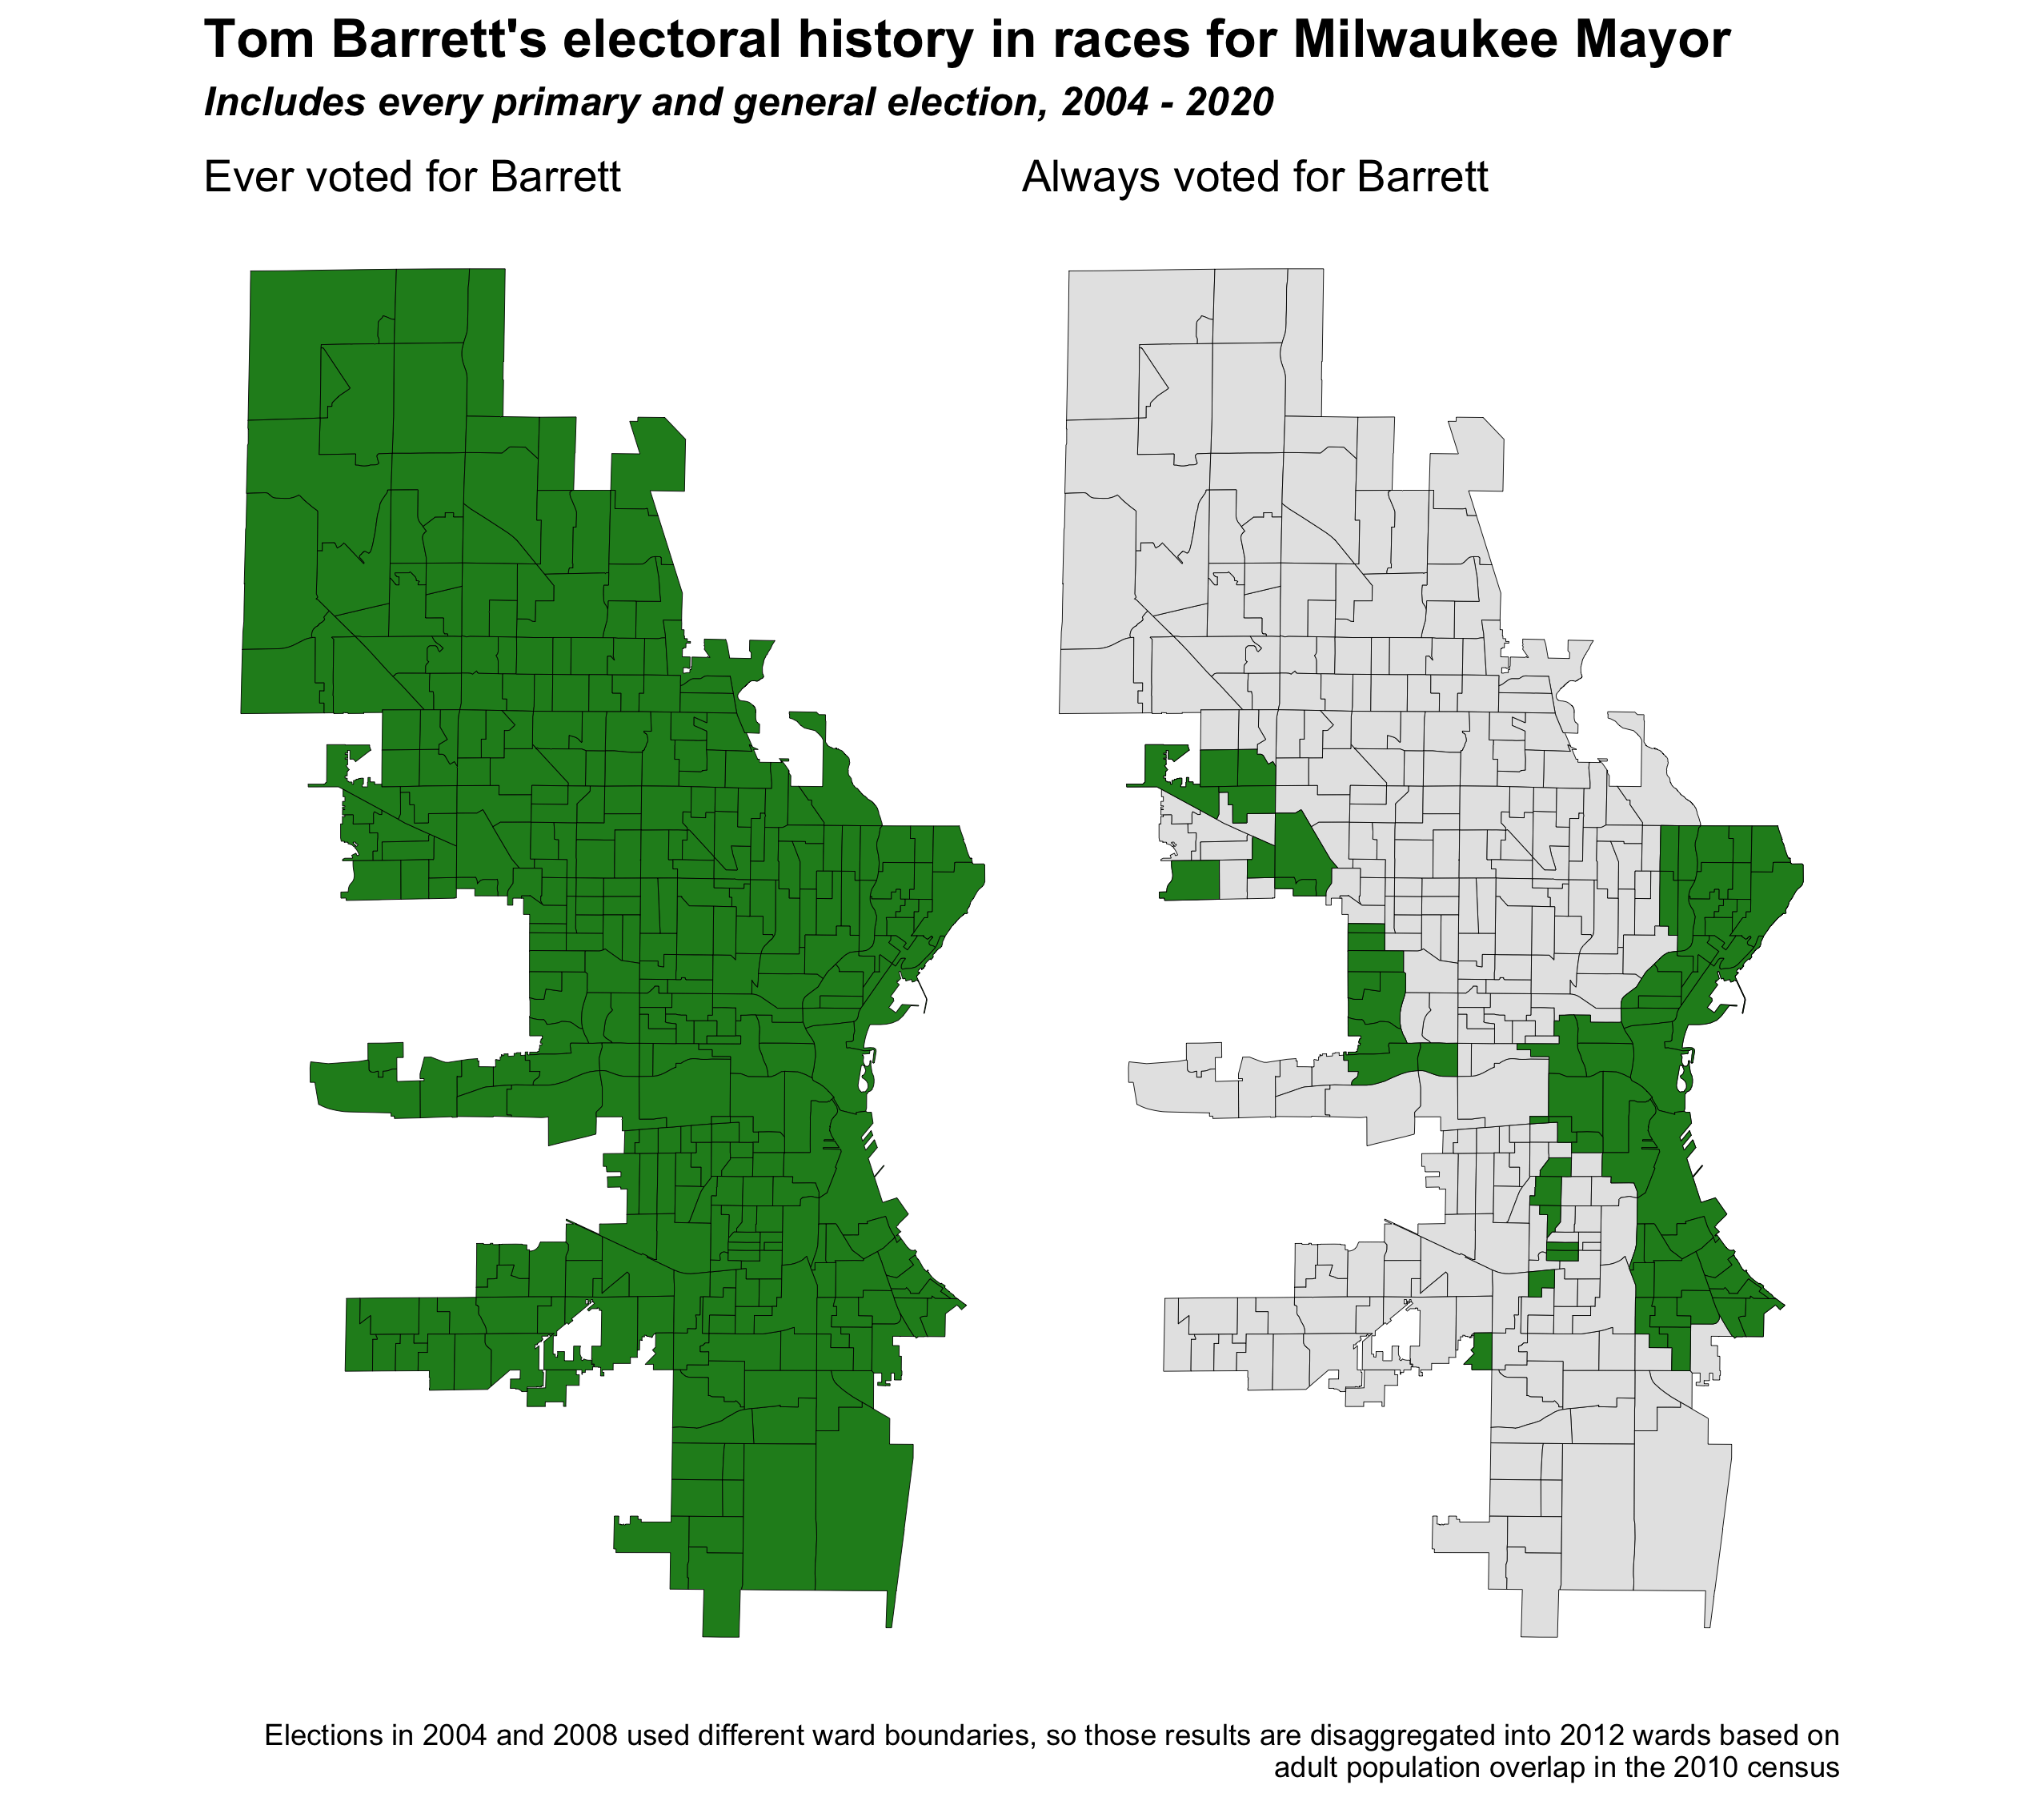
Tom Barrett won every part of Milwaukee at least once,2 but he only consistently won a quarter of it. For 3/4ths of the city, Barrett was not their first choice, but the non-Barrett enthusiasts were irreconcilably divided. In every election Barrett succeeded in being more palatable to the majority of the city than his various challengers.
The most contentious mayoral elections in Milwaukee always revolved around race, but not always in the same way. No matter the opponent, Barrett could always count on winning his base in progressive white neighborhoods along the lake (not to mention his own west side neighborhood of Washington Heights), but this was far from a majority of the city. When Barrett ran against Black candidates, he consistently won the more conservative white neighborhoods on the city’s far south and southwest sides. When those voters succeeded in advancing a conservative white candidate to the general election, then the Black north side neighborhoods of the city swung decisively behind Barrett.
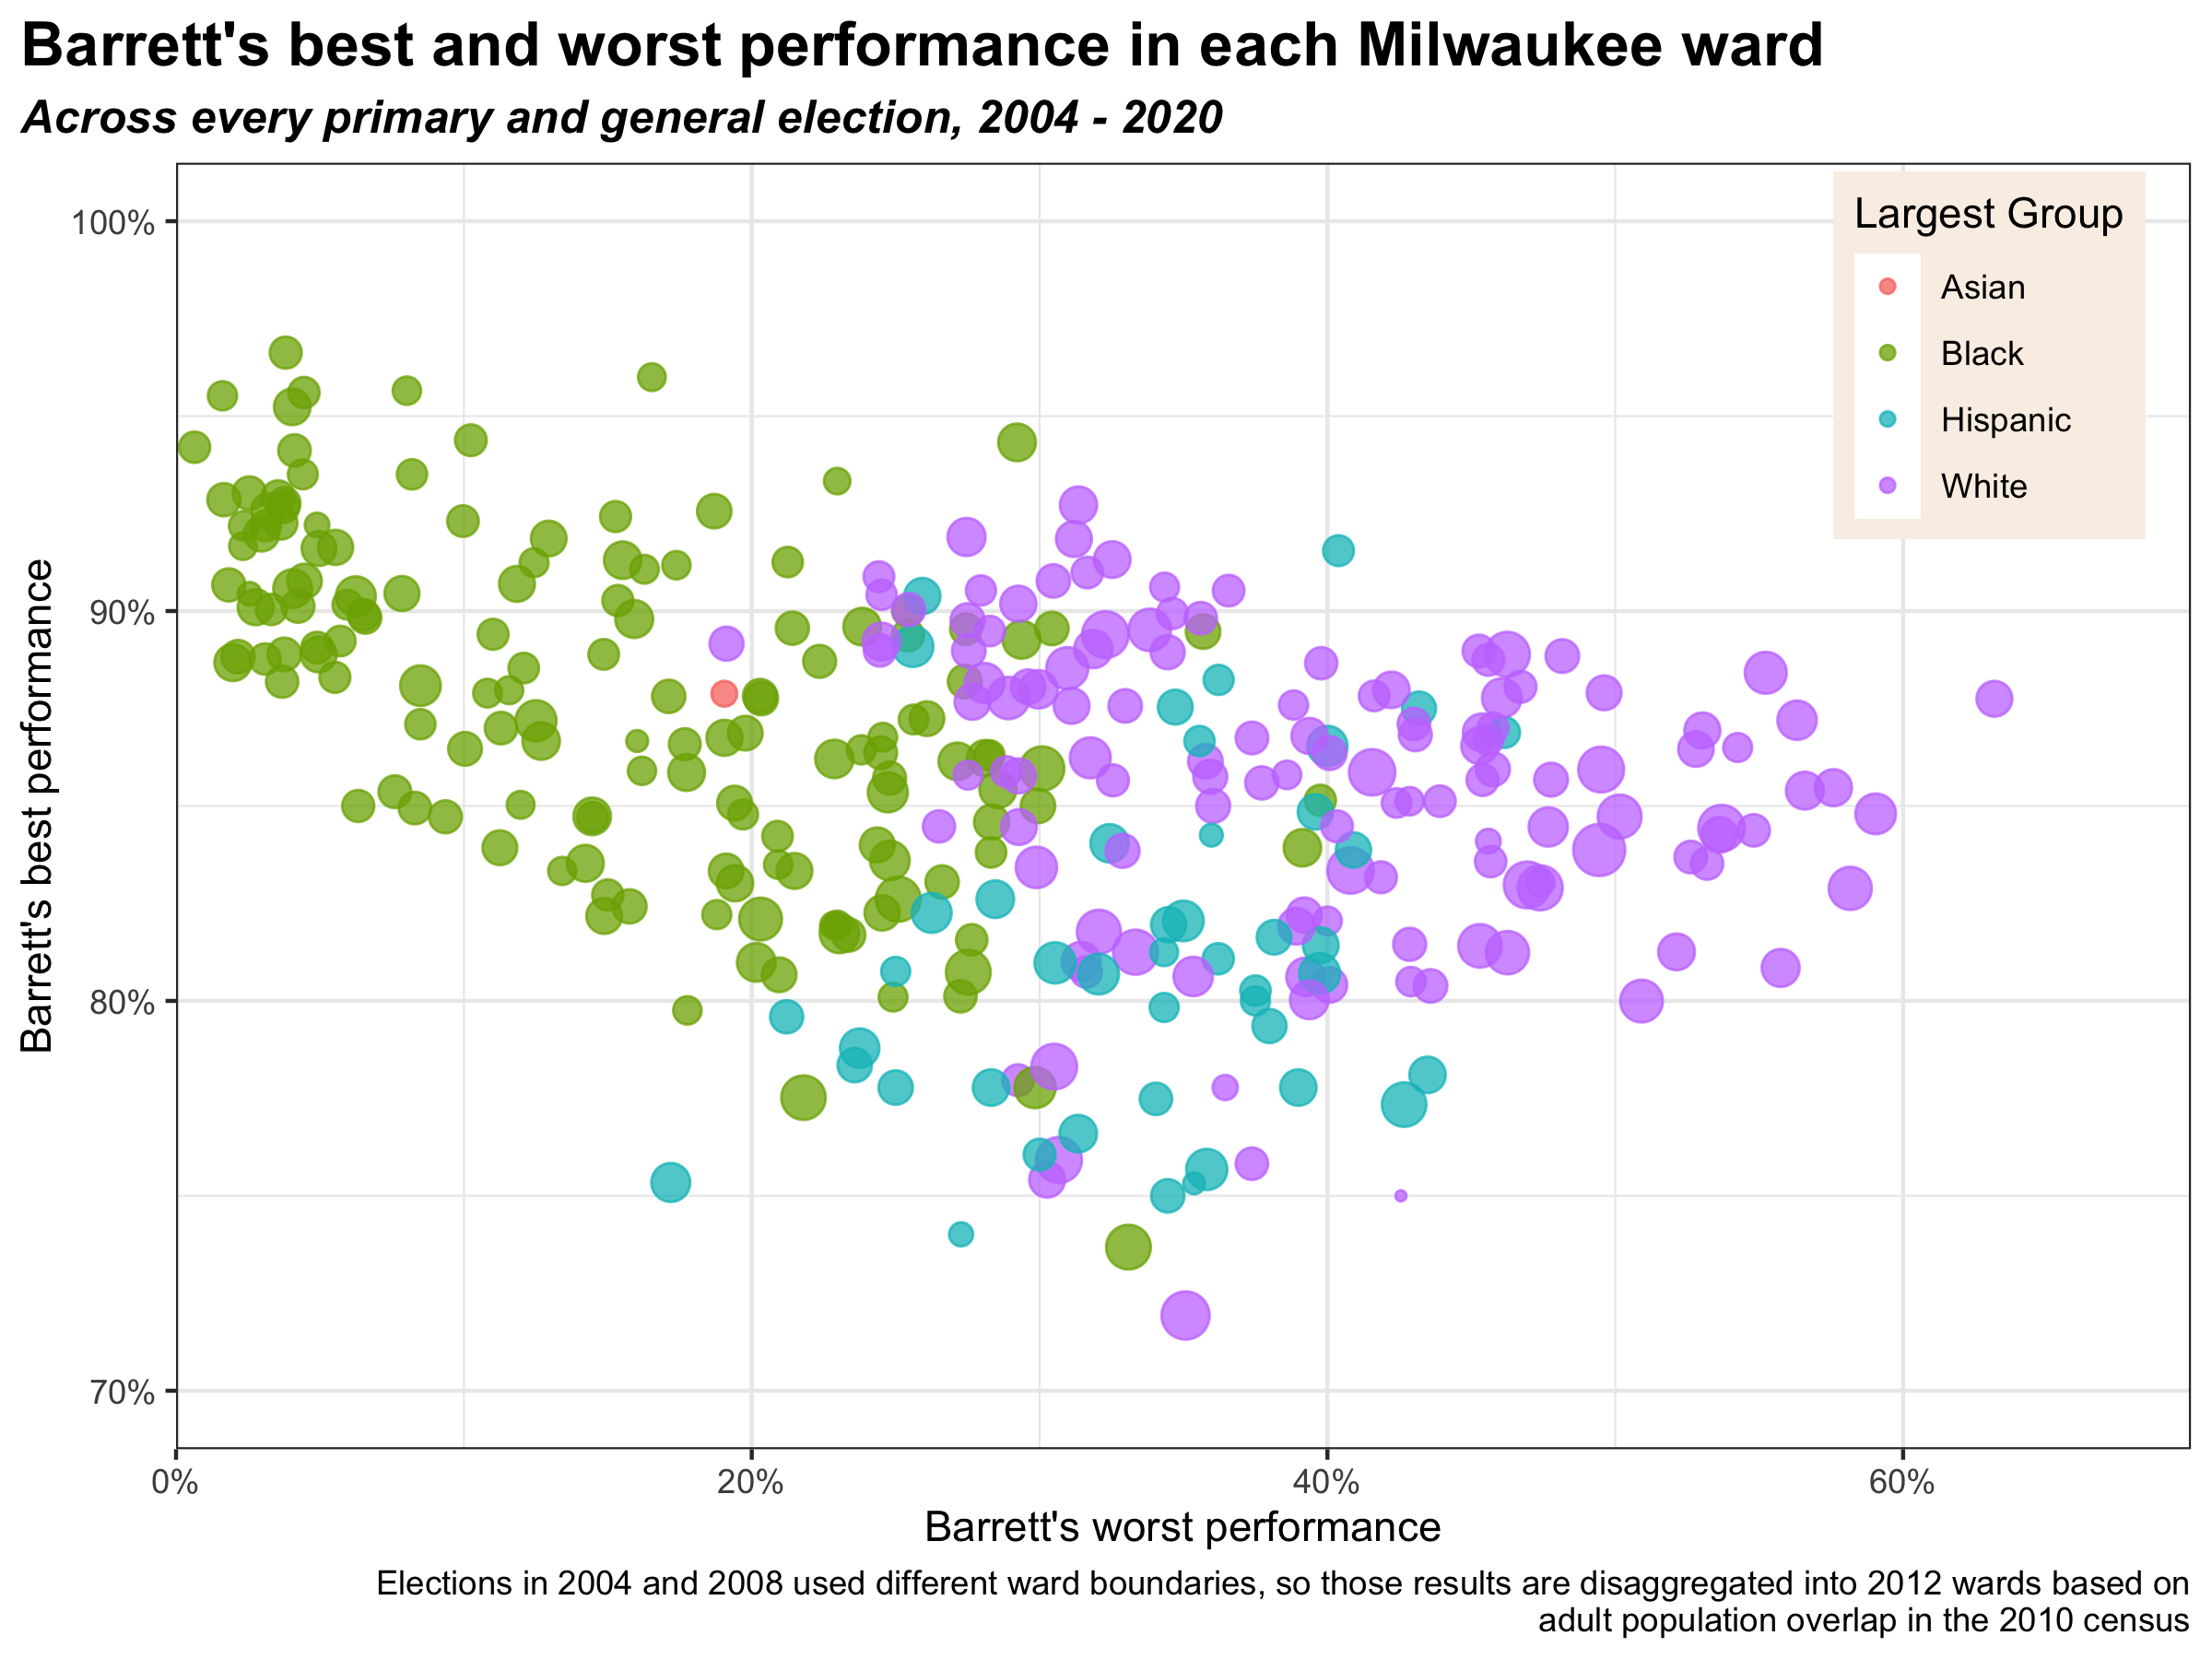
In a striking demonstration of the ability of Milwaukee’s Black neighborhoods to vote cohesively, Barrett’s best and worst performances occurred in majority Black wards.
2004
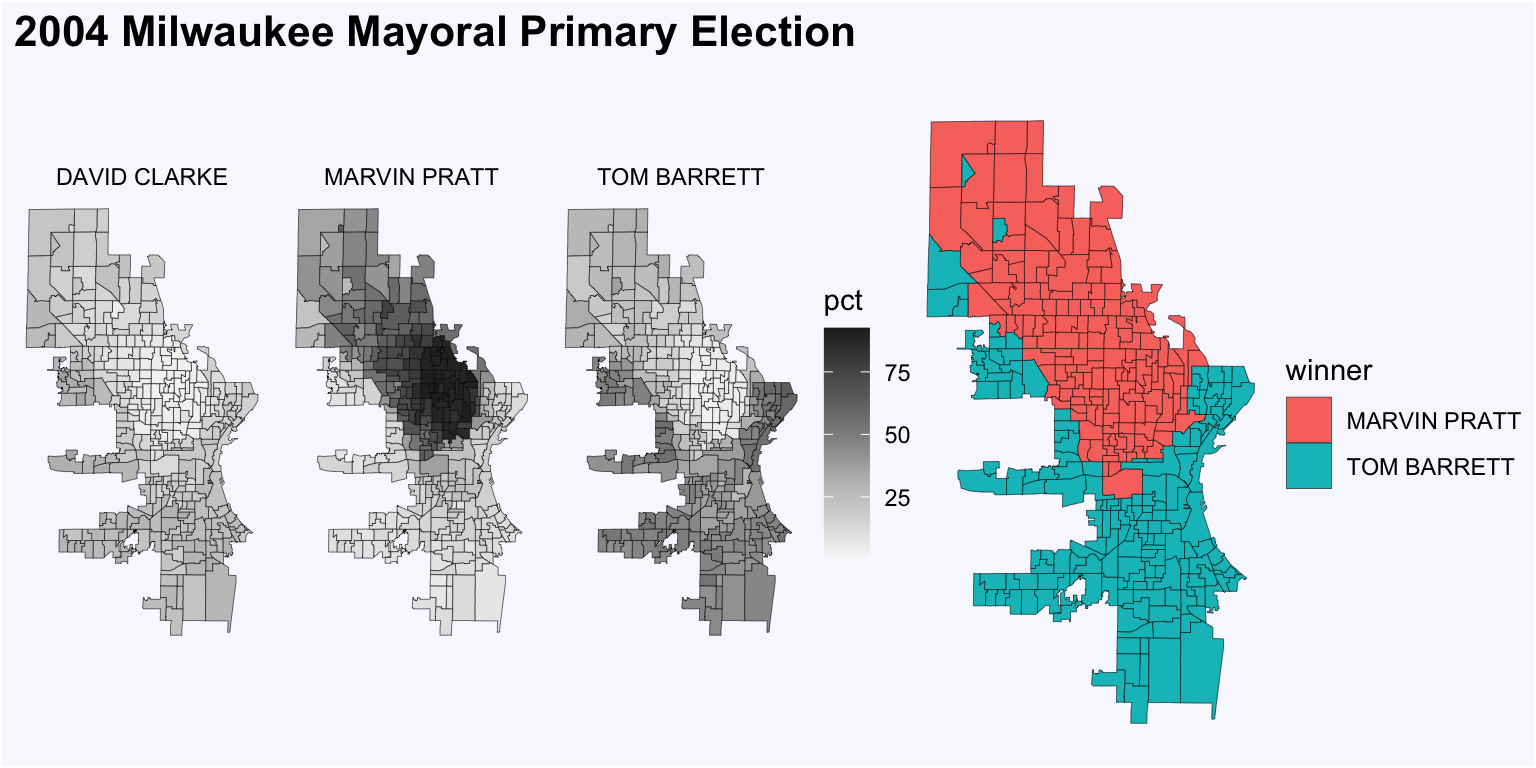
The 2004 mayoral election created one of the city’s most racially polarized electorates in recent memory. Ten candidates ran in the primary, but only three received more than 4% of the vote. Acting mayor Marvin Pratt lead the way with 38% of the vote. Longtime legislator and then- U.S. Representative Tom Barrett came second with 33%. Then- Milwaukee County Sheriff David Clarke received 17% of the vote, good enough for third place.
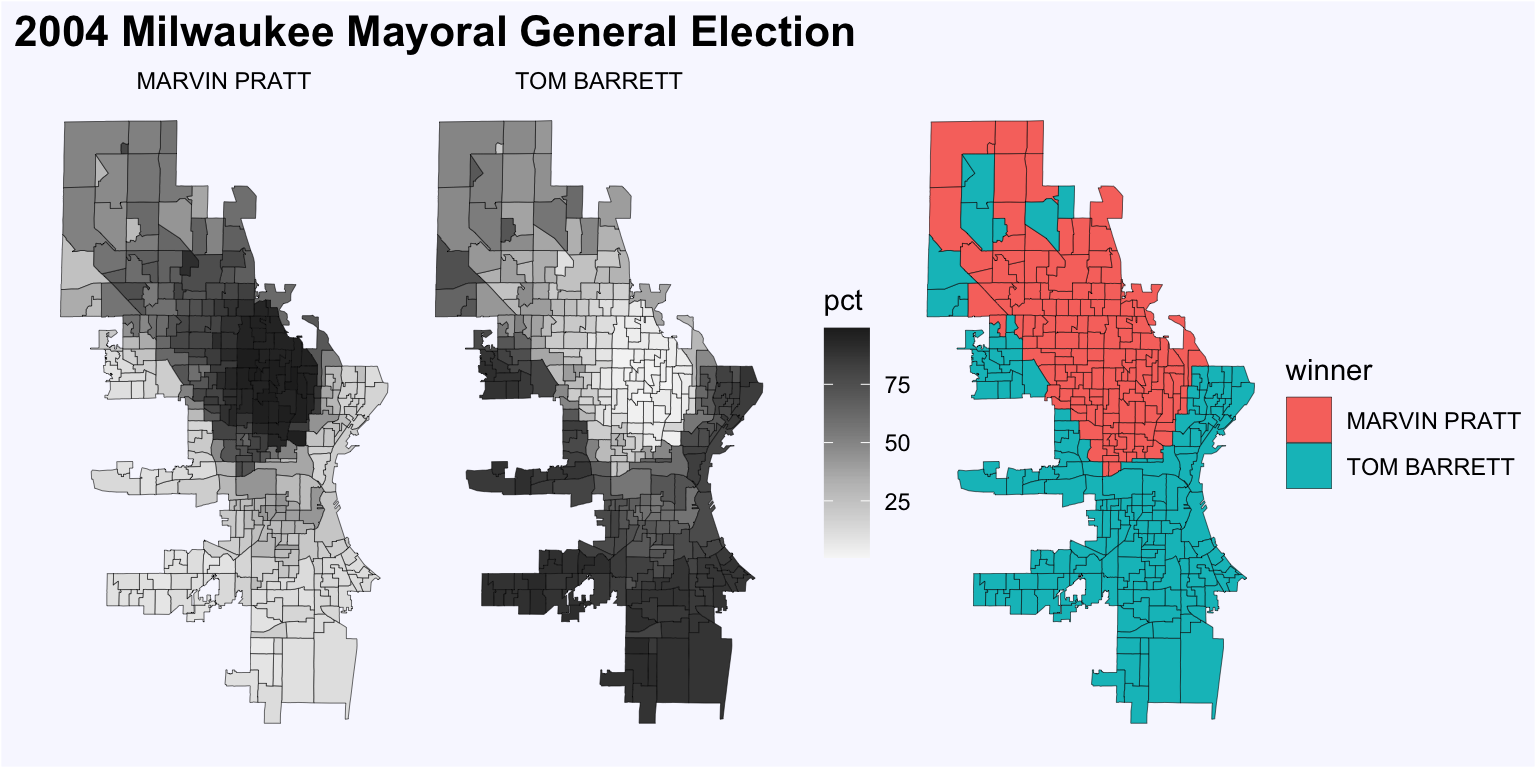
In the general election, Pratt increased his vote share only slightly, from 38% to 46%. Barrett consolidated the remaining vote and won the election with 53% citywide.
Pratt’s voters came overwhelmingly from majority Black wards.3 In both the primary and general election, he won all 121 of them. Barrett, by contrast, carried 133 out of 138 majority white wards in the general election.
A multivariate model finds that Barrett’s vote share in a given ward declined by about 9.4% for every 10% increase in the Black population share. Just controlling for race and ethnicity4 explains 98% of Barrett’s vote share in the 2004 general election.5. See the Appendix for full regression results.
Special thanks to Eileen Lipinski at the City of Milwaukee Municipal Research Library for helping me track down these ward-level election results in the city archives.
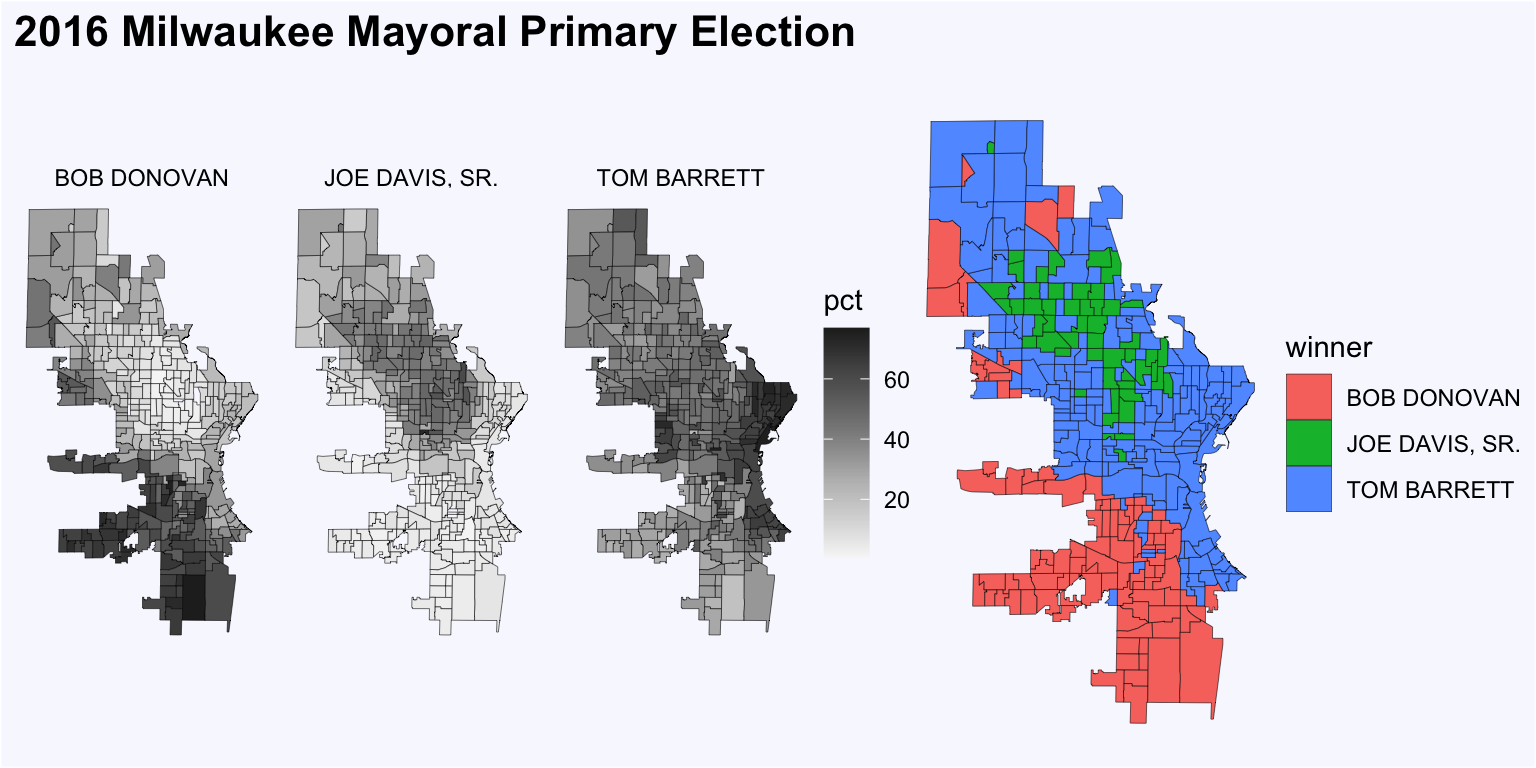
2016
Barrett cruised to victory in 2008 and 2012 against nominal opposition. He carried every single ward, taking 79% and 70% of the vote, respectively. In 2008, there wasn’t even a primary.
This meant 2016 was Milwaukee’s first seriously contested mayoral election in over a decade. Three candidates won significant vote shares in the primary. North side alderman Joe Davis, Sr. won 19% of the vote and 46 wards. Conservative south side alderman Bob Donovan took 32% and 98 wards. Barrett got his lowest vote share since February 2004, winning 46% of the vote and 141 wards.
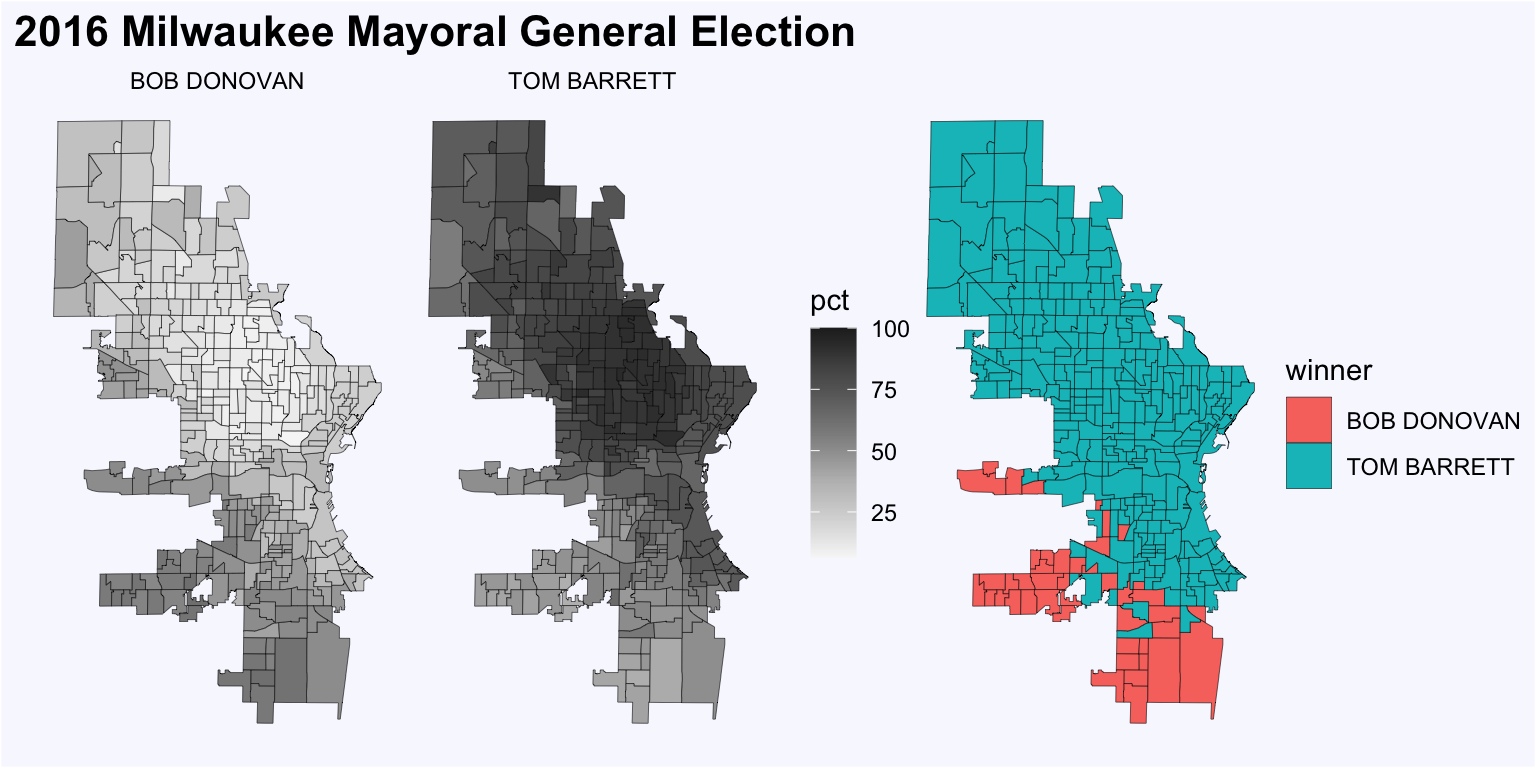
Given the choice between Barrett and Donovan, north side voters overwhelmingly chose Barrett. Although total votes cast for Donovan did increase in the general election, his overall share of the vote in the much larger general election actually fell slightly.
Every 10% increase in a ward’s Black share of the population correlated with a 3.3% increase in Barrett’s share of the vote. Recall that in 2004 the relationship was in the opposite direction.
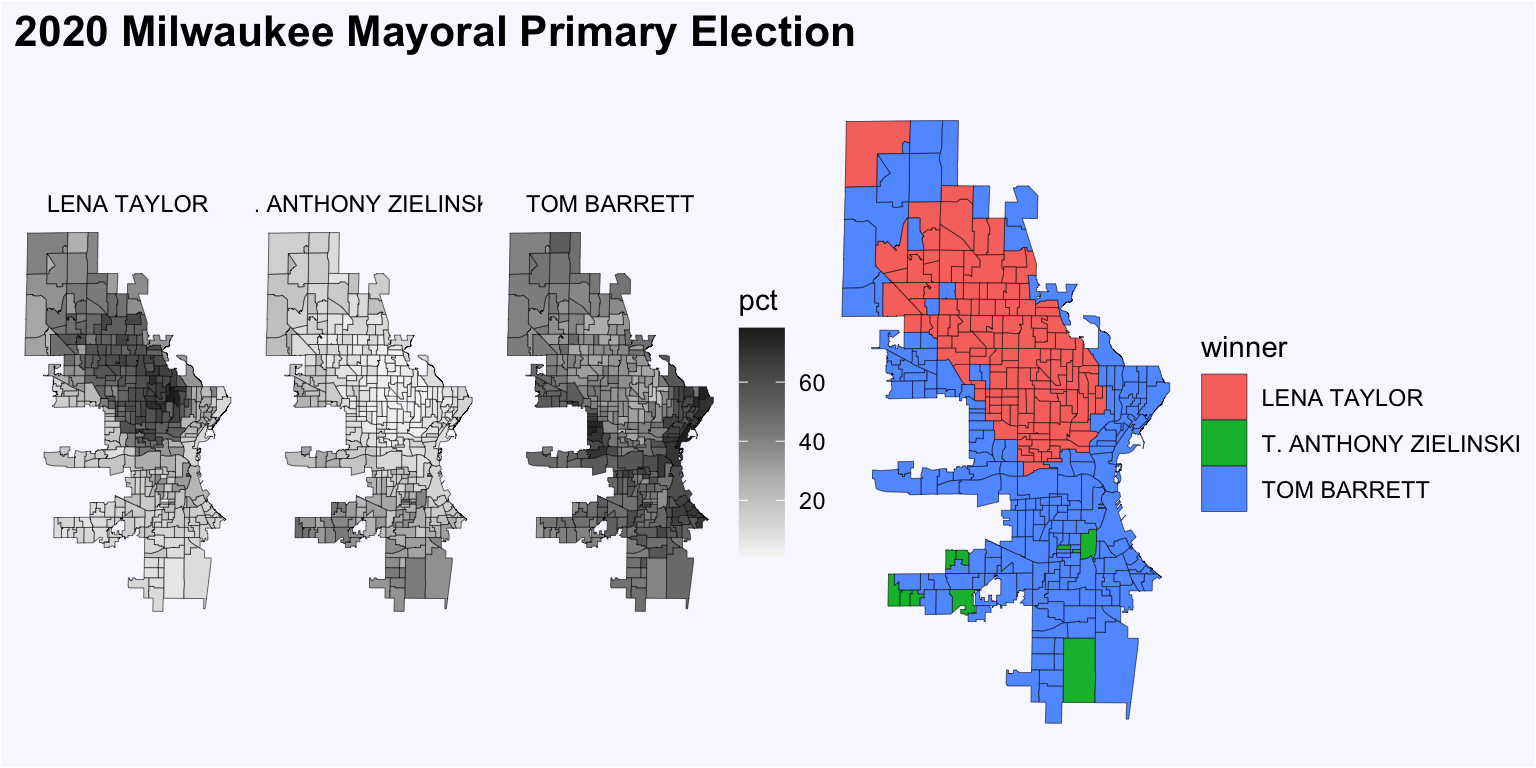
2020
The 2020 mayoral contest saw a similar dynamic in the primary. Once again, Barrett faced-off against a white south side conservative alderman (Tony Zielinski) and a well-known Black north side politician (State Senator Lena Taylor). This time, the conservative failed to advance. Zielinksi got just 15% of the vote and a meager 10 wards. Taylor carried 30% and 131 wards. Barrett still came first with 49% of the vote and 175 wards.
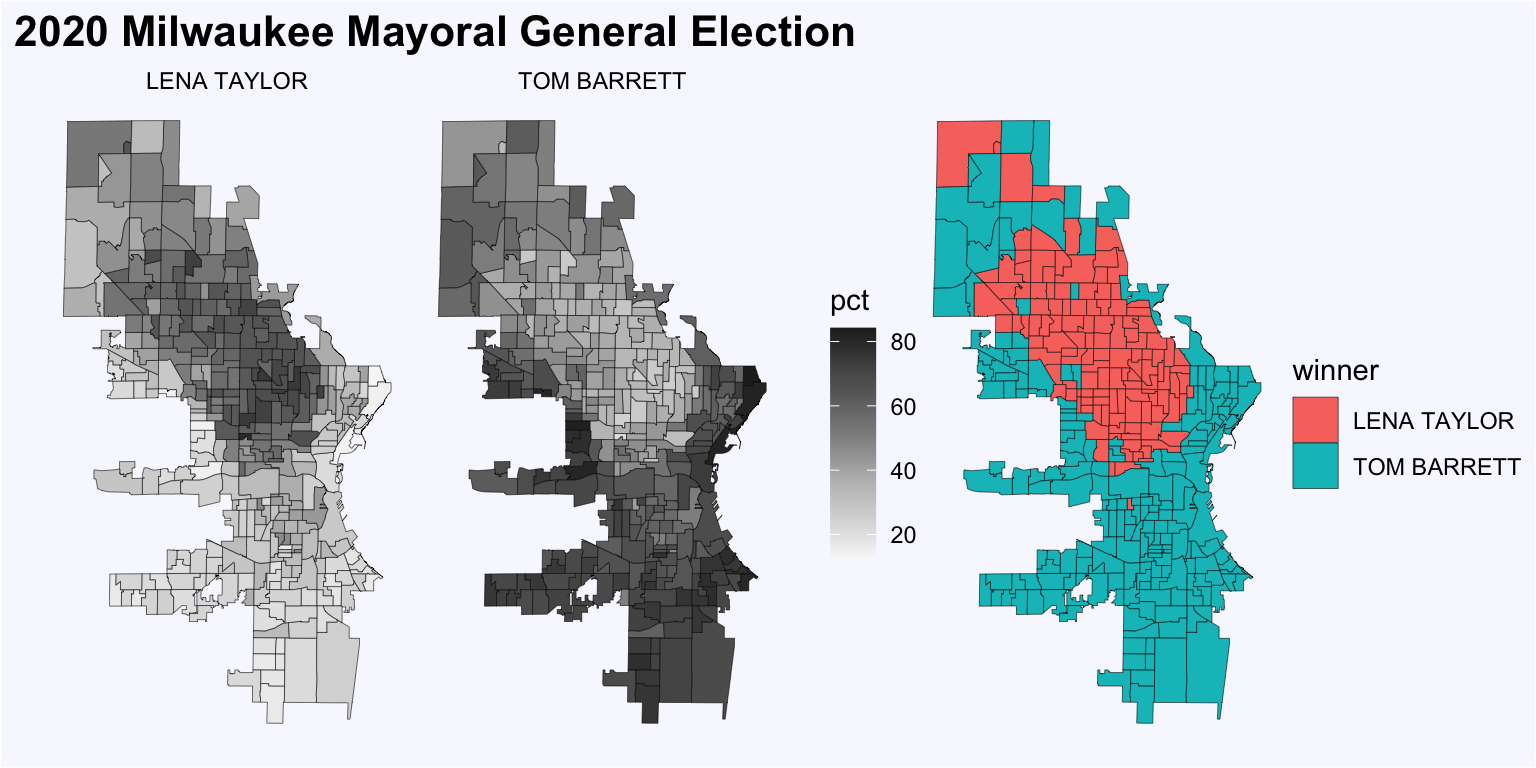
Taylor built on her strong primary performance on the north side, increasing her general election share of the citywide vote to 35%. She carried 120 of 143 majority Black wards. In the general election, a 10% increase in the Black share of a ward now correlated with a 4.7% decline in Barrett voteshare.
This time, however, the south and southwestern parts of the city, which had voted for Bob Donovan 4 years earlier, now coalesced behind Barrett in the general election, boosting him to 60% of the vote. Taylor won just 2 of 106 majority white wards.
Implications for the 2022 election
It’s easy to see the past in the current special election to replace Tom Barrett. Bob Donovan is running again, so is Lena Taylor. As in 2004, a Black acting mayor is trying to win the office in his own right.
But there are important differences between Milwaukee’s electorate in 2004 and today. In 2004, a majority of the city’s adults were probably still non-Hispanic white.6 Now, about 39% are. Thirty-five percent of Milwaukee adults are Black, 18% are Hispanic or Latino, and 5% are Asian. A successful mayoral candidate in 2021 must have a coalition that is, at least to some degree, multiracial.
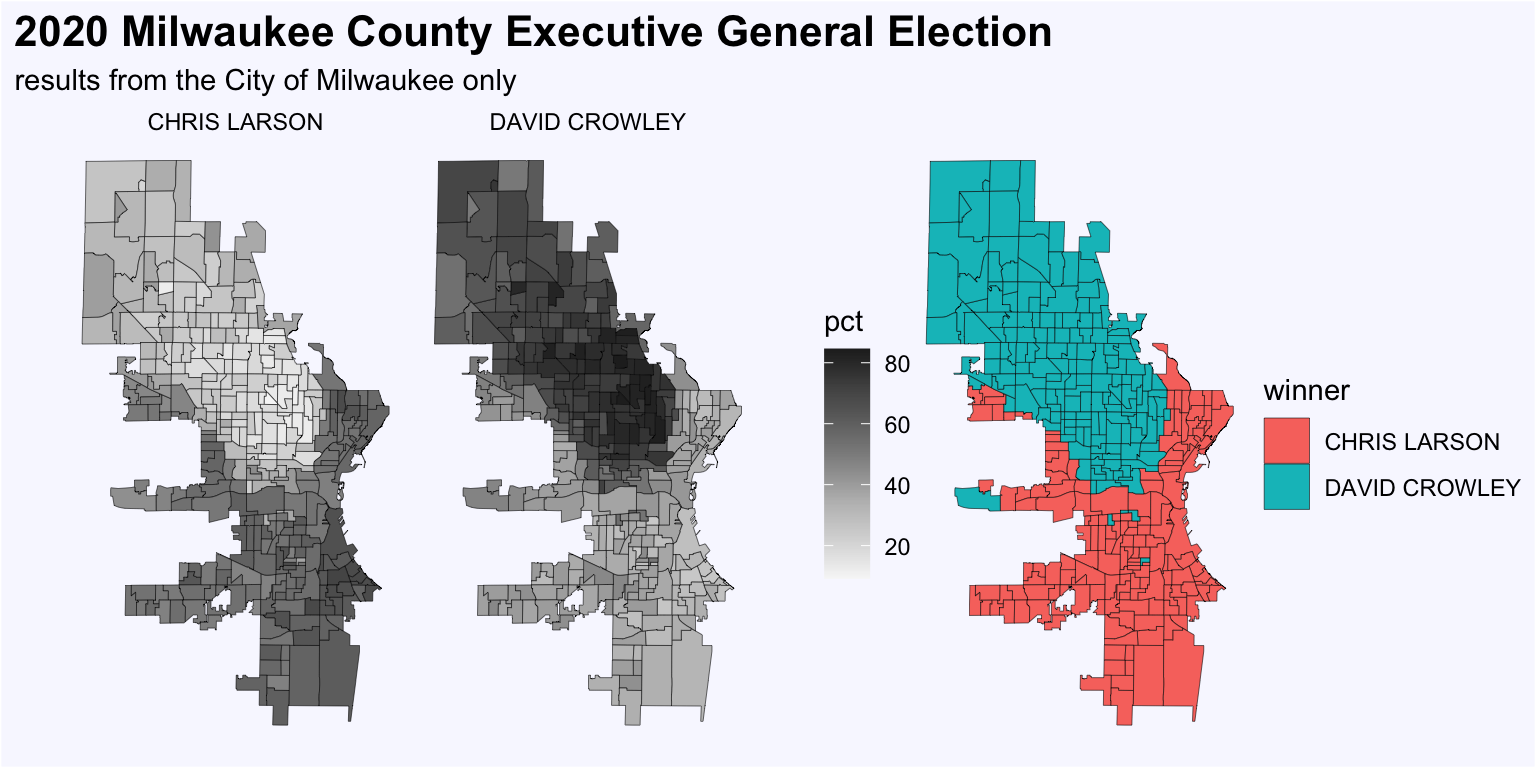
The composition of that coalition may be surprising. Consider the 2020 county executive race–the most recent high profile local election for an open seat in Milwaukee. The officially nonpartisan race pitted two well-known Democratic state legislators against each other. David Crowley, a Black State Assemblyman representing part of the north side, ran against Chris Larson, a white State Senator representing most of the East Side. Larson is an avowed liberal, while Crowley carved out a somewhat more moderate position.
Although this election followed the familiar pattern of the Black candidate winning the north side and the white candidate winning nearly everywhere else, this time the Black candidate won a majority. In addition to winning countywide, Crowley carried the City of Milwaukee with 52% of the vote to Larson’s 48%.
In a tightly-contested race like this, small vote shifts matter a lot. Crowley’s dominant vote share (74%) in majority Black wards was insufficient to win the city overall. Crowley won because he was better than Larson at getting votes outside of his geographic base. Larson won 25% of the vote in majority Black wards. Crowley won 39% of the vote in majority white wards. In fact, Crowley did somewhat better in more conservative white parts of the city compared to more liberal ones. Among majority white wards, Crowley took more of the vote in places that Donovan won in 2016’s primary than in wards Barrett won.
This pattern also extended to the suburbs. For instance, Larson handily won the liberal suburb of Shorewood, while Crowley narrowly defeated him in Franklin, Milwaukee County’s most conservative suburb.
Tom Barrett won his first term as mayor by consolidating the white vote and defeating near unanimous support for Marvin Pratt in the city’s majority Black wards. In subsequent elections, Barrett vastly expanded his appeal. His landslide victories in 2008 and 2012 were only slightly correlated with race, and he clearly won majority support from every group. In more contentious elections, Barrett received support and opposition alternately from the parts of the city outside his base along the lakeshore.
Given Milwaukee’s more diverse population, I do not think a candidate with Barrett’s 2004 coalition could win the mayor’s office. The next mayor will necessarily come to power via a more diverse set of supporters. But the nature of that coalition is unclear. David Crowley set one example, combining a strong performance on the north side with a significant minority of white voters, particularly from the far south and southwest sides.
Other coalitions could also be victorious. I’ve scarcely mentioned the Latino community in this analysis. Latinos now make up a fifth of the city’s population and 15% of its adults, but they have lower rates of both citizenship and electoral participation. The political diversity of Latino voters also should not be underestimated. To the extent that Milwaukee Latinos can be described as a singular political constituency, I think their full electoral influence has yet to be felt.
Milwaukee voters have a long tradition of keeping incumbents around. Barrett’s enduring personal popularity helped him gain the backing of markedly different political coalitions. While he was the consistent first choice of a minority of voters, he was more acceptable than the alternative to nearly every voter in the city at one time or another.
It has been 18 years since Milwaukee last chose a new mayor. Some new voters will have spent their entire life with Mayor Barrett. Without that familiar name on the ballot, Milwaukee’s next mayor has the opportunity to forge an entirely new political coalition.
Appendix
This table shows the results of OLS regressions on Milwaukee wards where each racial or ethnic group’s population shares are the regressor variables and Tom Barrett’s vote share in the general election is the dependent variable. Models are shown for each general election featuring Barrett.
| Dependent variable: | |||||
| Tom Barrett’s general election vote share | |||||
| 2004 | 2008 | 2012 | 2016 | 2020 | |
| (1) | (2) | (3) | (4) | (5) | |
| Black or African American | -0.941*** | 0.014* | 0.124*** | 0.335*** | -0.471*** |
| (0.008) | (0.008) | (0.011) | (0.018) | (0.015) | |
| Hispanic or Latino | -0.267*** | -0.048*** | 0.088*** | -0.090*** | -0.205*** |
| (0.016) | (0.015) | (0.019) | (0.028) | (0.023) | |
| Asian | -0.637*** | -0.108* | -0.068 | 0.064 | -0.485*** |
| (0.070) | (0.061) | (0.062) | (0.093) | (0.071) | |
| Other/Multiple | -0.404 | 0.897** | -0.165 | -0.962* | -1.845*** |
| (0.351) | (0.366) | (0.479) | (0.557) | (0.328) | |
| Constant (100% white) | 91.895*** | 76.982*** | 65.573*** | 62.046*** | 86.168*** |
| (0.736) | (0.896) | (1.499) | (2.495) | (1.979) | |
| Observations | 312 | 312 | 317 | 324 | 324 |
| R2 | 0.982 | 0.076 | 0.304 | 0.671 | 0.781 |
| Adjusted R2 | 0.982 | 0.064 | 0.295 | 0.667 | 0.779 |
| Residual Std. Error | 4.221 (df = 307) | 4.432 (df = 307) | 5.980 (df = 312) | 9.203 (df = 319) | 7.379 (df = 319) |
| F Statistic | 4,260.544*** (df = 4; 307) | 6.335*** (df = 4; 307) | 34.012*** (df = 4; 312) | 162.467*** (df = 4; 319) | 285.142*** (df = 4; 319) |
| Note: | p<0.1; p<0.05; p<0.01 | ||||
Footnotes
There was no primary in 2008.↩︎
Technically, Barrett never won ward 326, but almost nobody lives there, and it rarely records any votes cast.↩︎
Ward demographics are interpolated linearly between the nearest decennial census counts.↩︎
Categories used are Hispanic or Latino of any race, Black or African American, white, Asian, or other.↩︎
Adjusted R-squared of 0.982↩︎
We don’t have any census estimates from 2004, but in 2000 54% of Milwaukee adults were non-Hispanic white, dropping to 45% in 2010.↩︎