How Donald Trump is Changing the Map in Milwaukee County
Small shifts from one election to another may be random and temporary, but consistent changes across three elections show something more enduring.
Across 29% of Milwaukee County, Trump in 2016 was more popular than Mitt Romney and he grew more popular still in each reelection campaign. In another 26% of the county he was less popular than Romney and continued to decline in each reelection campaign. Throughout the remainder of the county, his popularity has fluctuated—in most places dipping in 2020 and growing in 2024.
![]()
For this analysis, I compared the election results from each Milwaukee County suburb along with the 15 City of Milwaukee aldermanic districts (using 2024 boundaries).[i] Each aldermanic district is home to about 38,000 residents, making their population about the same as Oak Creek or Franklin.
Consider the following four regions.
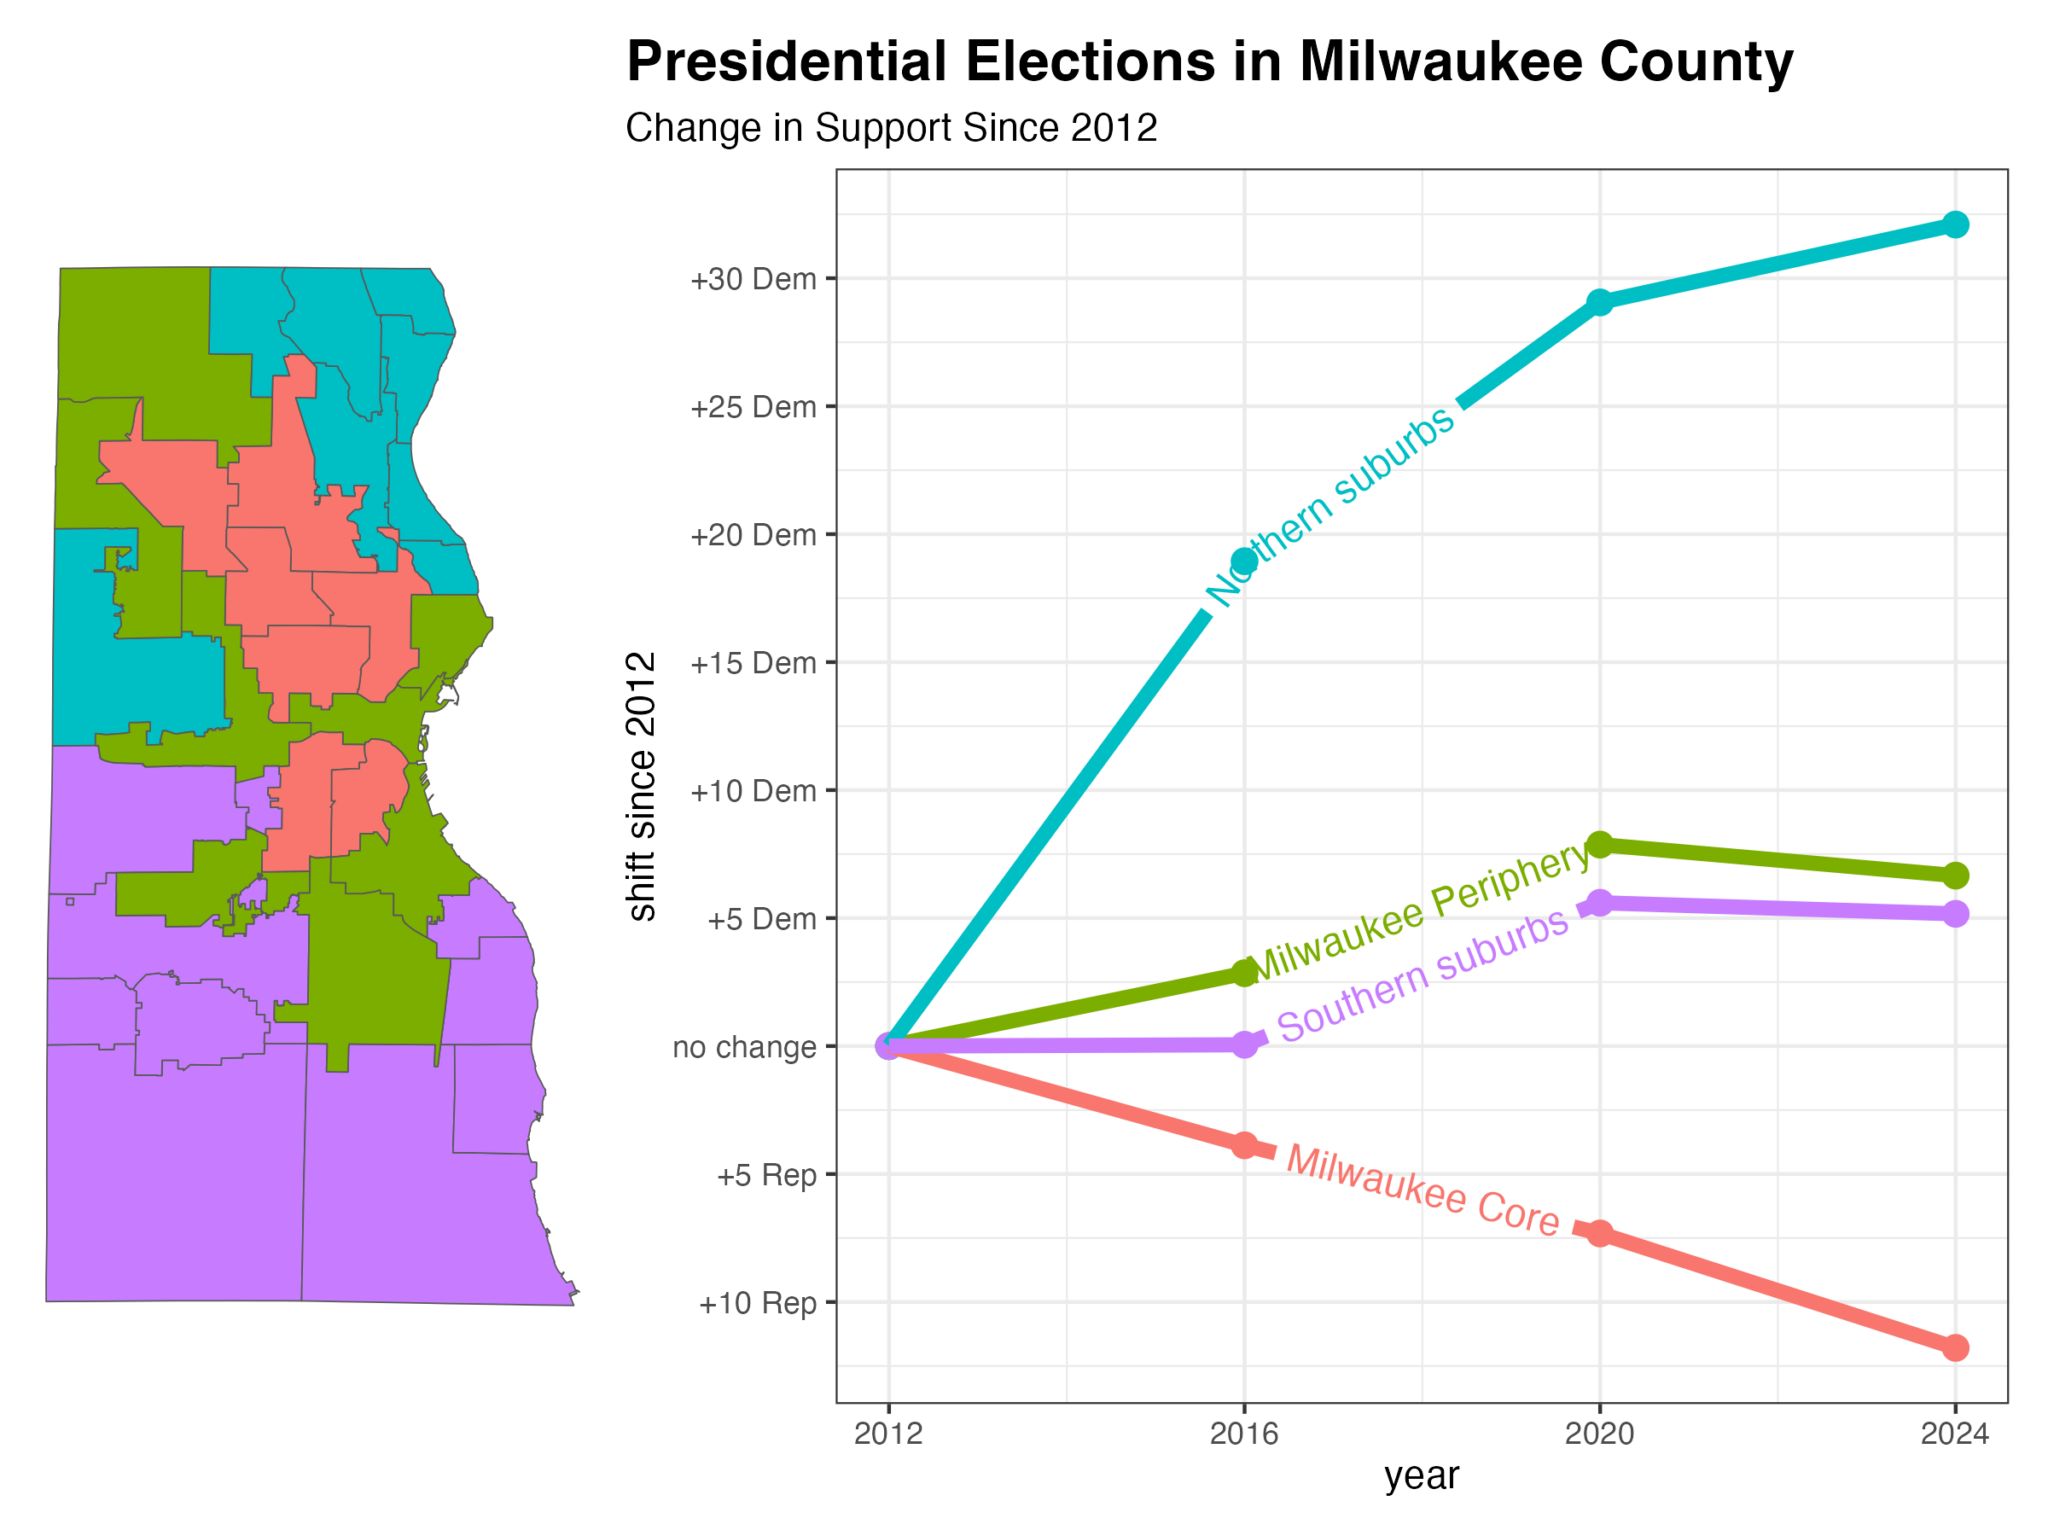
Milwaukee Core
About 269,000 people live in the Milwaukee core region. This is the poorest area, with a per capita income of $22,000. Only 15% of adults over age 24 have a bachelor’s degree. About 14% of adults are white, 56% are black, and 23% Hispanic.
The voters in the Milwaukee core overwhelmingly support Democratic candidates—Kamala Harris won these 7 districts combined by 74 points. But Donald Trump has made significant inroads here. His 2024 performance was 12 points better than Mitt Romney’s in 2012.
Trump’s improvement here has been practically monotonic. Trump in 2016 was 3.9 points more popular than Romney in 2012. Trump in 2020 was 3.4 points more popular than Trump in 2016. And Trump in 2024 was 4.5 points more popular than Trump in 2020.
Northern Suburbs
The opposite political trend is occurring in Milwaukee’s northern suburbs (pop. 116,000). Across these communities the adult population is 78% white, 64% of those over 24 have a college degree, and the per capita income is $58,000.
Voters here have shifted sharply to the left in response to Trump. Romney lost the area by 13 points, Trump 2016 by 32 points, Trump 2020 by 42 points, and Trump 2024 by 45 points.
Southern Suburbs
Milwaukee County’s southern suburbs (pop. 246,000) are more working class than their northern counterpart. About 33% of adults over 24 have a college degree, and the per capita income is $41,000. The same share of population is white (78%) as in the northern suburbs, but more residents are Hispanic and fewer are Black.
The southern suburbs have long been the most conservative part of the county. Trump won them by 2.2 points in 2016, before losing them by 3.4 in 2020 and 2.9 in 2024.
Milwaukee Periphery
This leaves the collection of neighborhoods I’m calling the “Milwaukee periphery,” as they surround the Milwaukee core. These eight aldermanic districts hold 308,000 residents. The adult population is 57% white, 21% Black, and 14% Hispanic. The per capita income ($37,000) is slightly lower than in the southern suburbs, but the share of those ages 25 and up with a college degree (37%) is slightly higher.
Collectively, the Milwaukee Periphery gave Harris a 45-point victory, virtually identical to her margin of victory in the Northern Suburbs. However, the Trump-era political trajectory of the periphery has more closely resembled that of the southern suburbs.
Trump in 2016 declined by 2.8 points relative to Romney in 2012, and Trump in 2020 was 5 points less popular here than in 2016. Then, the trend reversed slightly, with Trump in 2024 improving by 1.2 points over his 2020 defeat.
Educational sorting
The results in Milwaukee are consistent with the national political realignment in the Trump era. If anything, Trump’s increase in support in Milwaukee’s urban core may trail the changes seen in some other cities.
Formal educational attainment remains one of the clearest predictors of a neighborhood’s changing levels of support for Donald Trump. About 32% of Wisconsin adults (ages 25 and older) have earned a bachelor’s degree (or more).
Since 2012, Democrats have gained the most in the parts of Milwaukee county where more than 50% have earned a bachelor’s degree. Democratic gains have been smaller in places where between 30% and 50% of adults have a college degree.
In places where college degree attainment trails the state average, Trump has usually made gains.
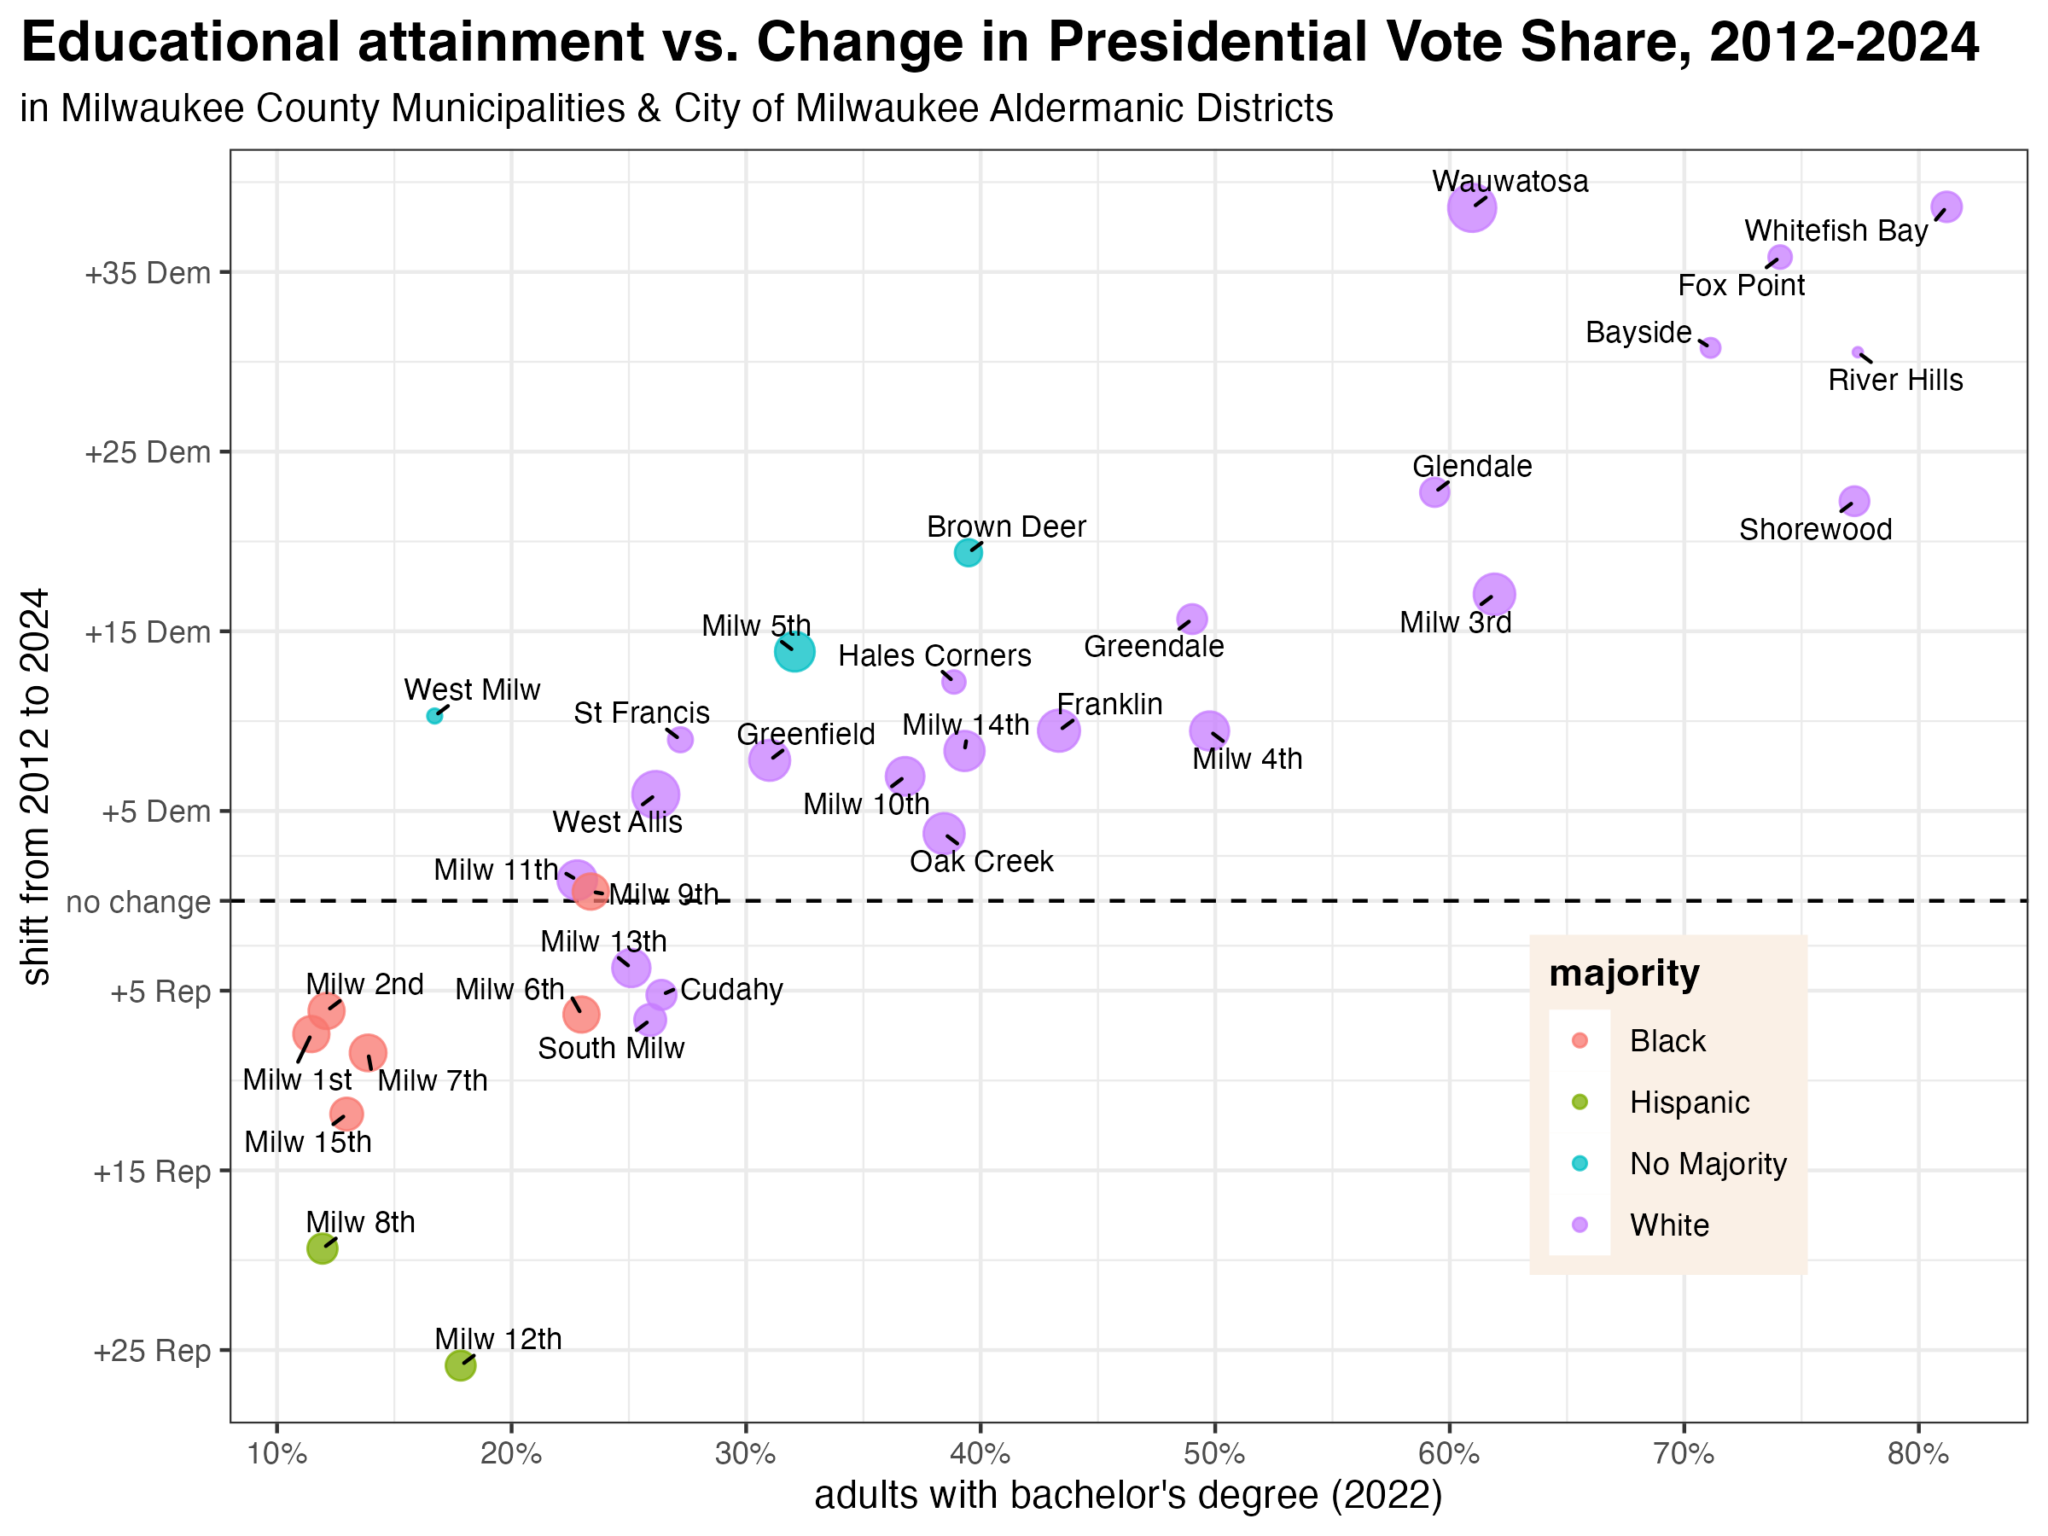
There are exceptions. Fewer than 20% of adults in the Village of West Milwaukee have a college degree, but Harris’ margin of victory was 10 points larger than Obama’s in 2012. This increase in Democratic support likely reflects changes to the racial composition of West Milwaukee, where the non-Hispanic white share of the population declined by about 15 percentage points over the past decade.
Keep this point in mind. Even though Black and Latino voters give Republicans more support than they once did, they still vote for Democrats at a higher rate than white voters overall. Consequently, an increase in the Black or Latino population of a community is still likely to increase its Democratic vote share.
Data Note:
See this repository for the data and graphics used in this article.
This table shows the trend in each Milwaukee County suburb and city aldermanic district in 2012 and 2024.

Data note: Past elections were held under different ward boundaries, so I aggregated the Milwaukee city results into the current alder districts based on population overlap.