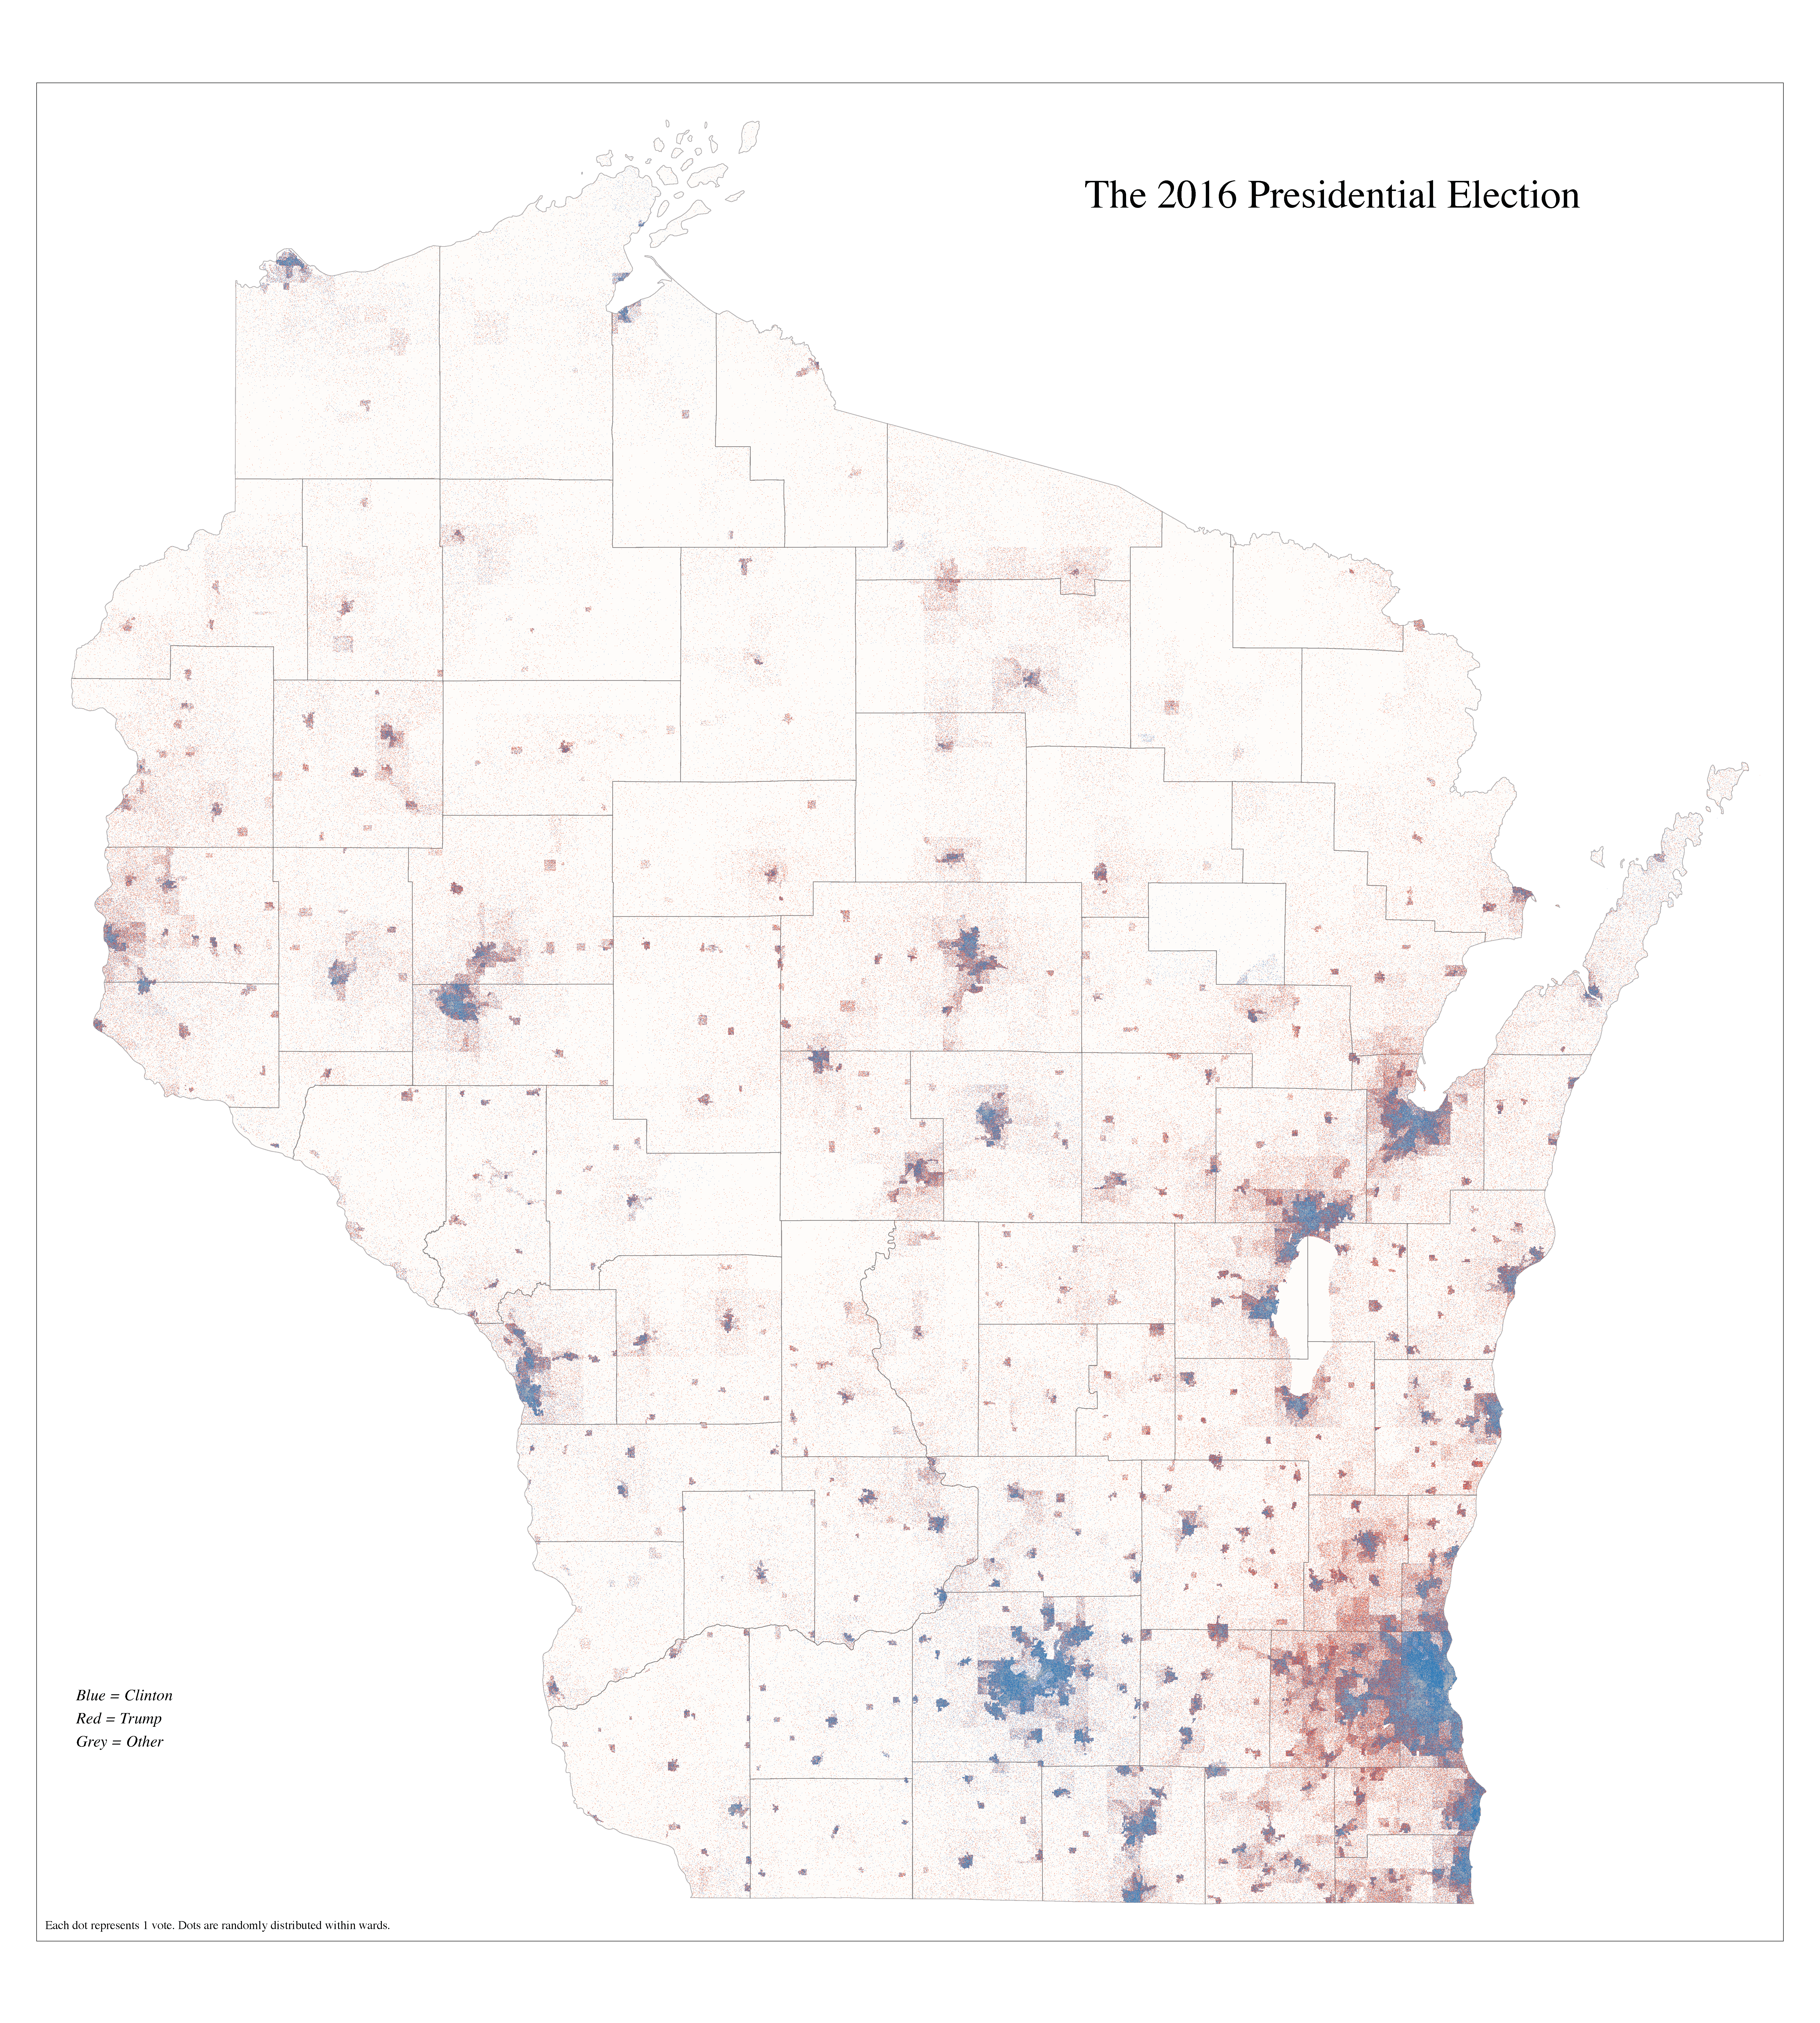
Wisconsin 2016 Presidential Election Dot Map
1 dot for each vote
This map shows the results of the Wisconsin 2016 Presidential election.1 Each blue dot represents a vote for Hillary Clinton. A red dot is a vote for Donald Trump. And a grey dot is a vote for someone else. Each dot is randomly distributed within the ward in which it was cast.2 There are 6,895 total wards. I used a dataset and shapefile from the excellent Wisconsin Legislative Technology Bureau to create it.
