An alternative way of mapping county-level data in Wisconsin
The basic flaw of choropleth maps is widely understood. Using land area to represent any other kind of data is inevitably going to leave some kind of misimpression. Objections to choropleth maps often peak right after an election angry losers (and winners) promote the map styles whose visual strategy they find most comforting. As the cartographer Ken Fields has extensively demonstrated, the best way to gain a comprehensive understanding is to consider many different styles of maps. If made well, each will highlight some aspects of the truth, while inevitably obscuring others. There is no one ideal map.
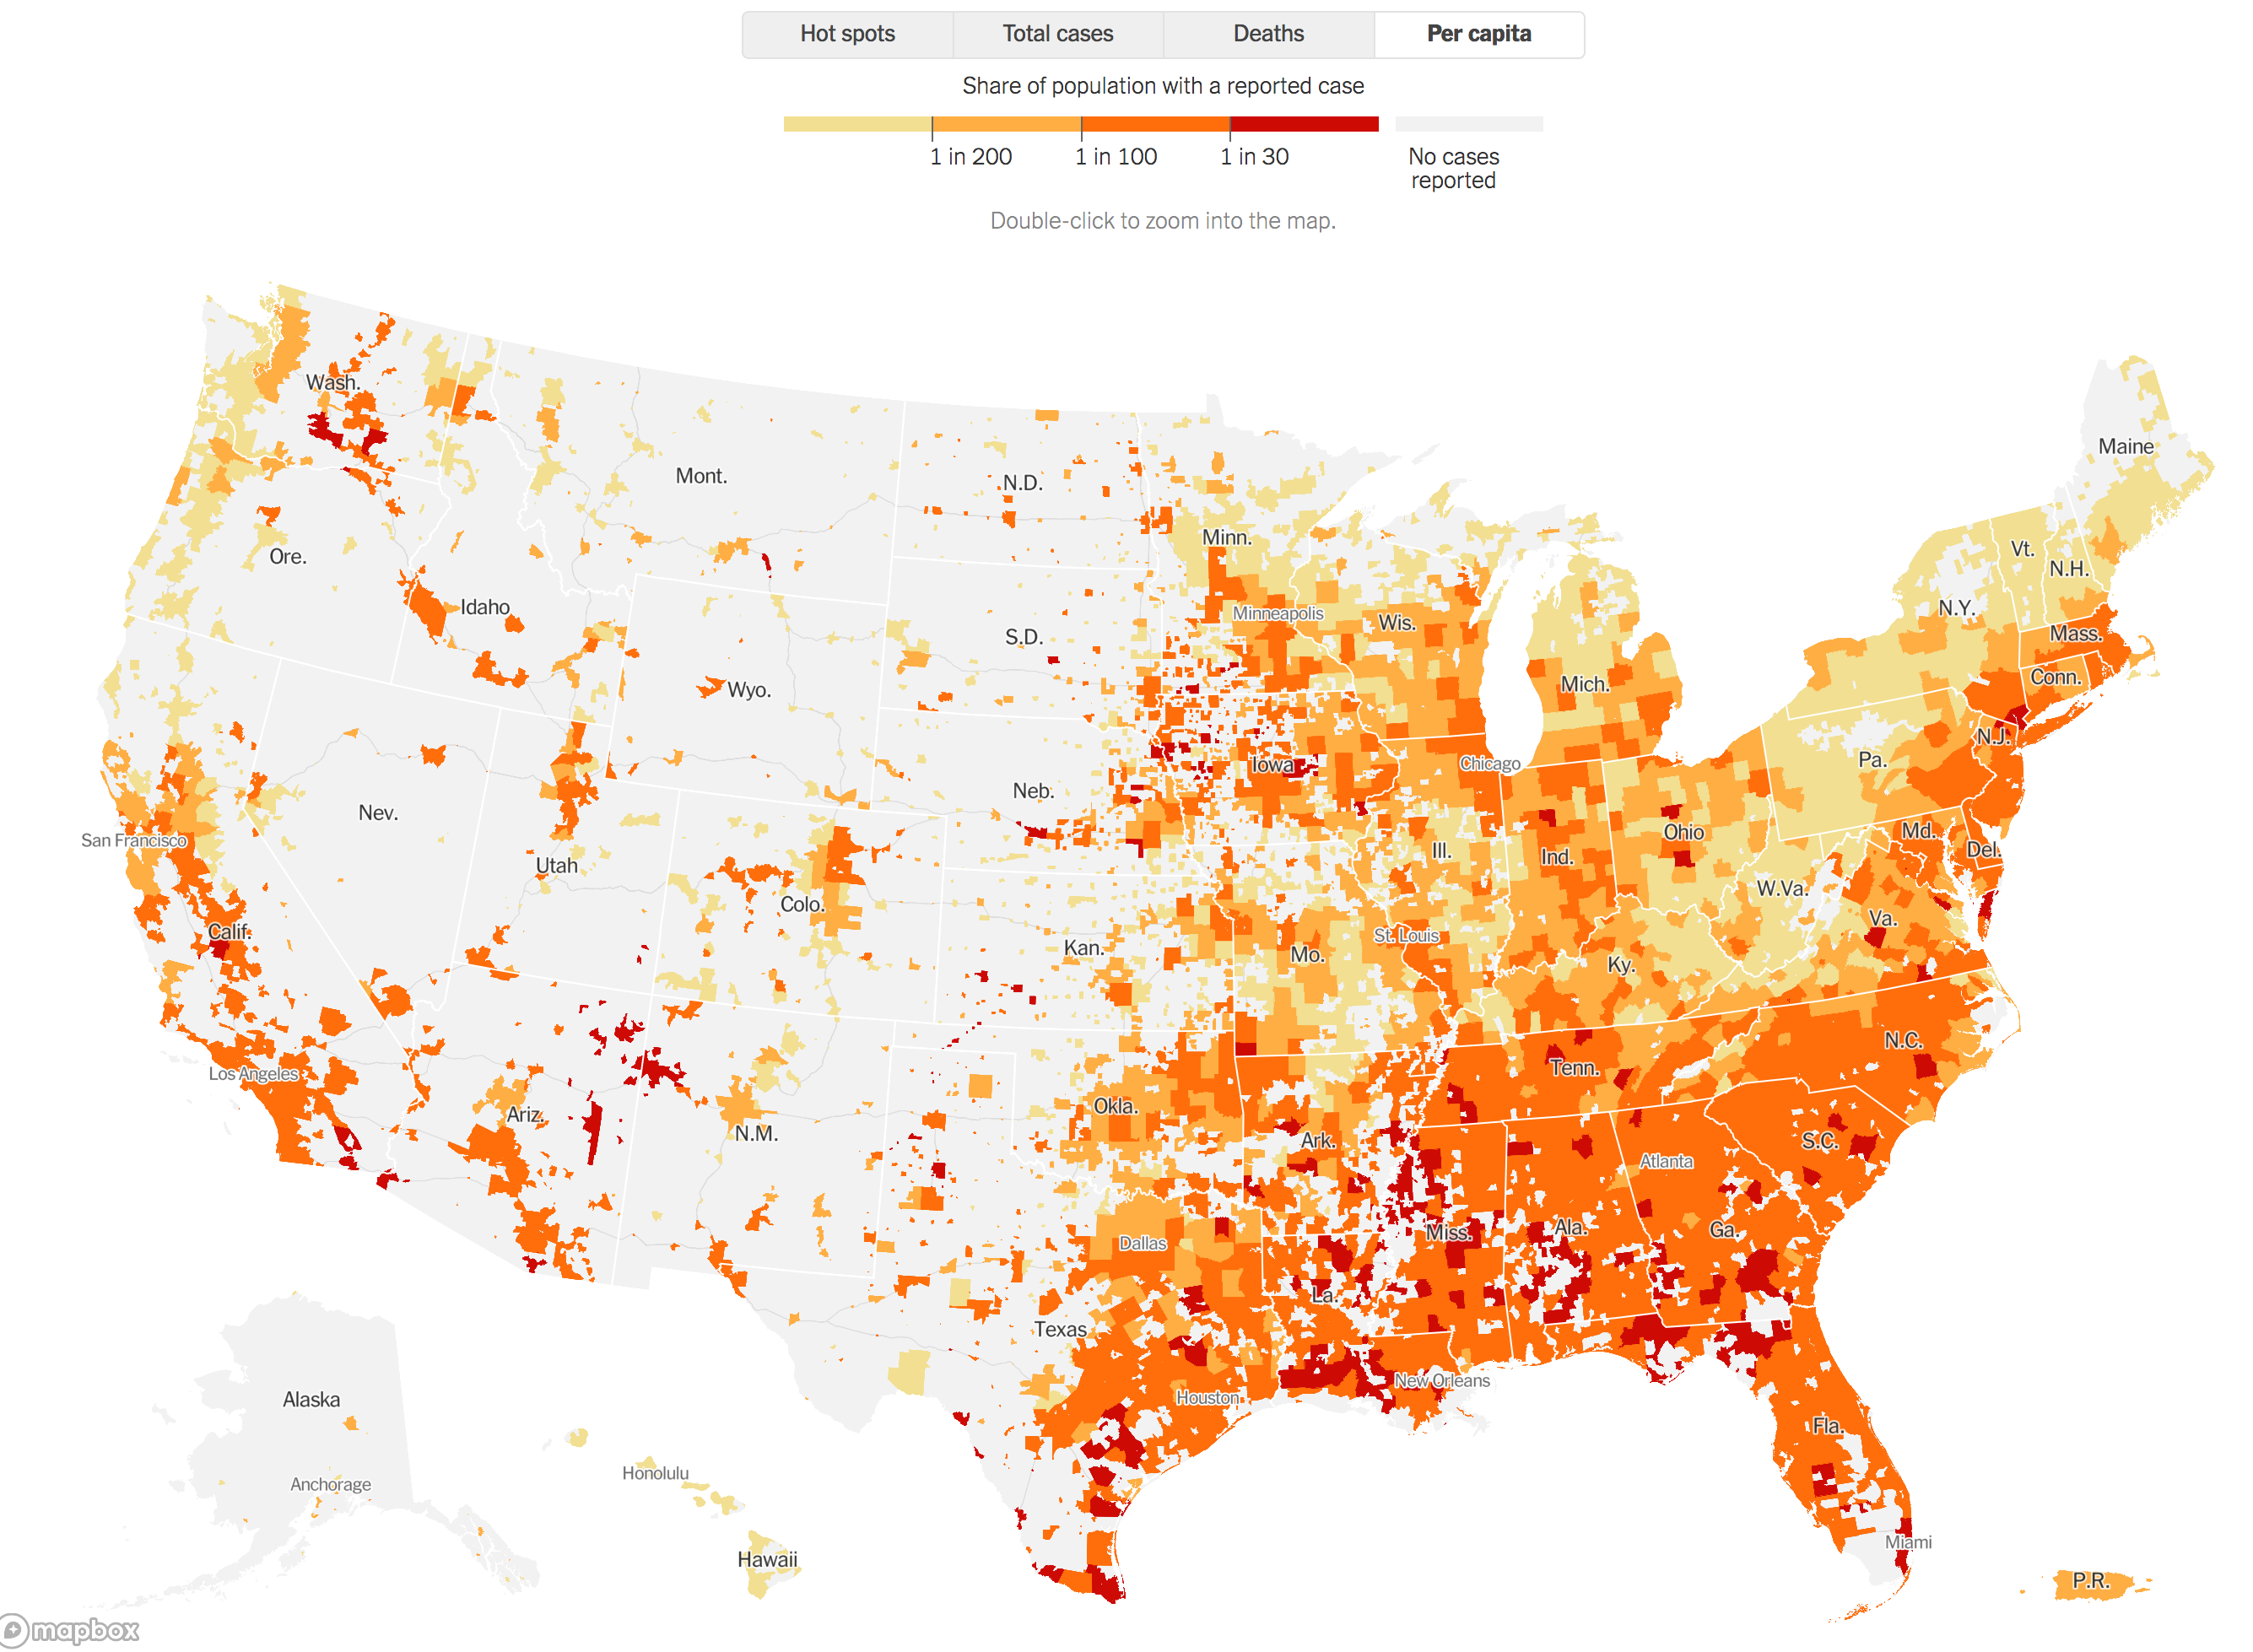
The New York Times has begun using a new (to me) variation on choropleths for their U.S. COVID-19 county-level maps. Consider the image below.
This map shows per capita data on recent cases by county. But some of the largest counties in the country also have exceedingly low populations. Using a dark color appropriately emphasizes the intensity of the local outbreak, but (as with votes) coloring the entire county suggests a much larger population than actually exists. So, instead of shading the entire county with the appropriate color, NYT simply shades the parts of the county with a population density of at least 10 people per square mile.
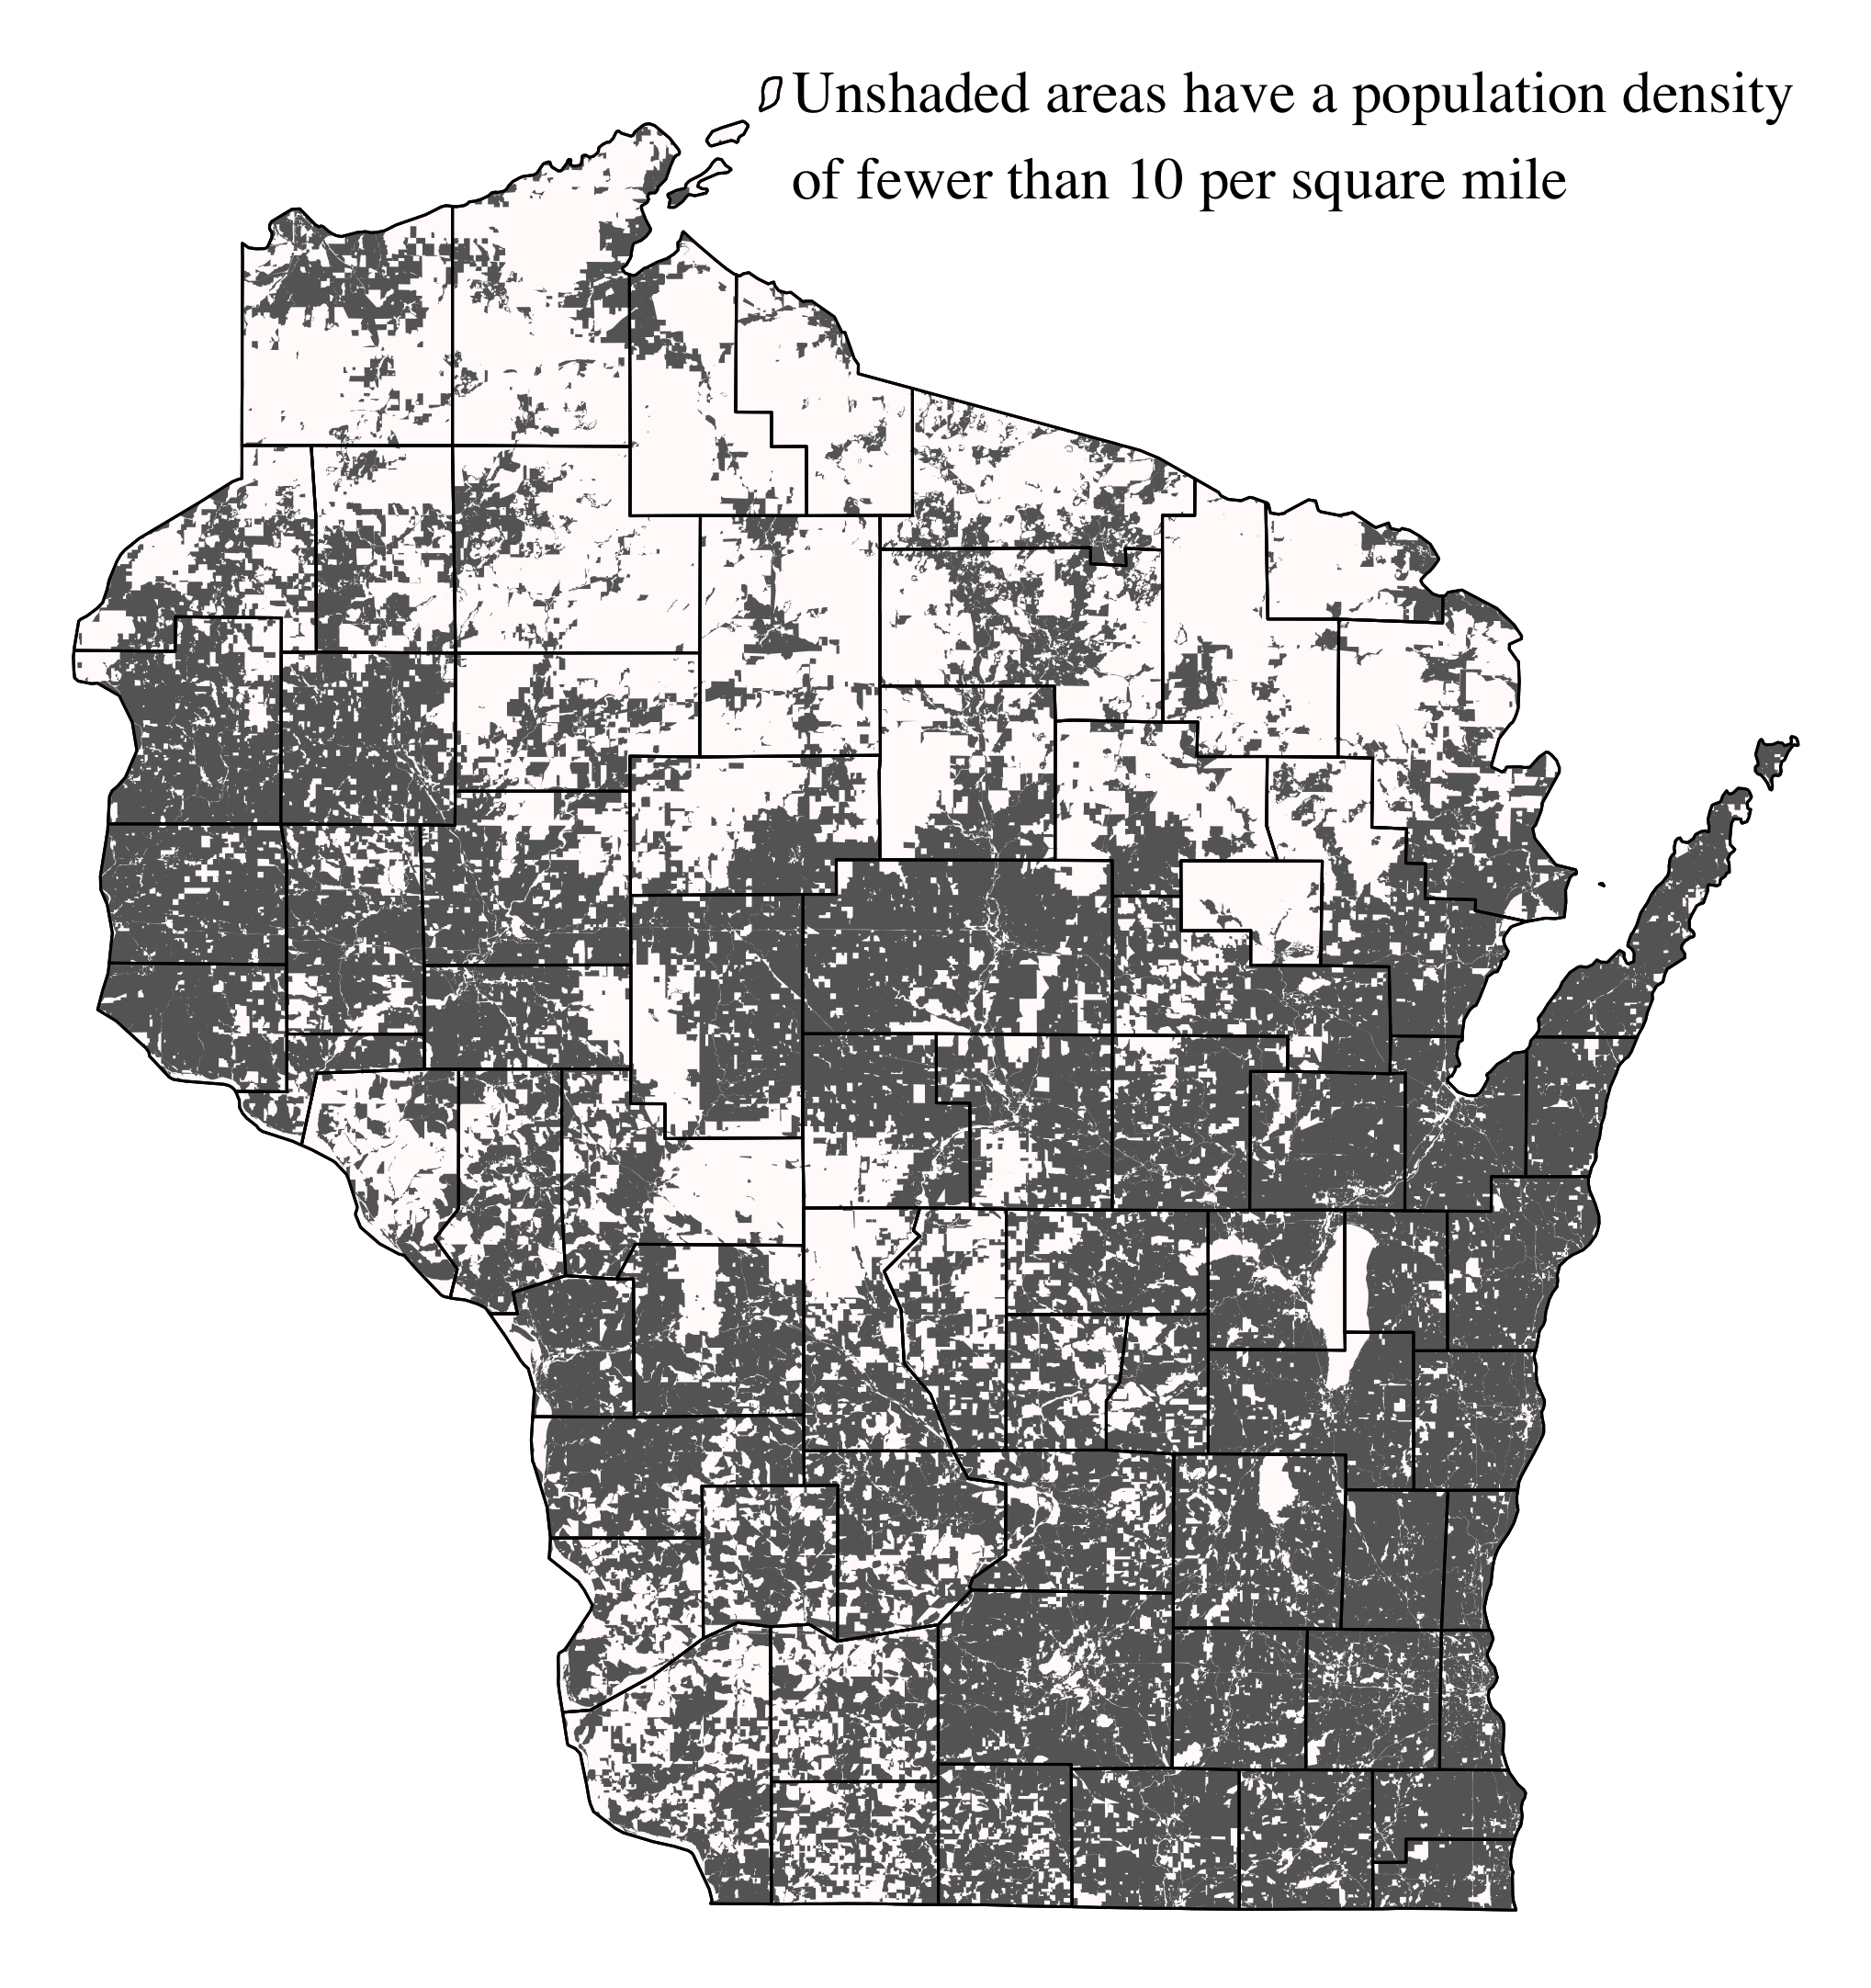
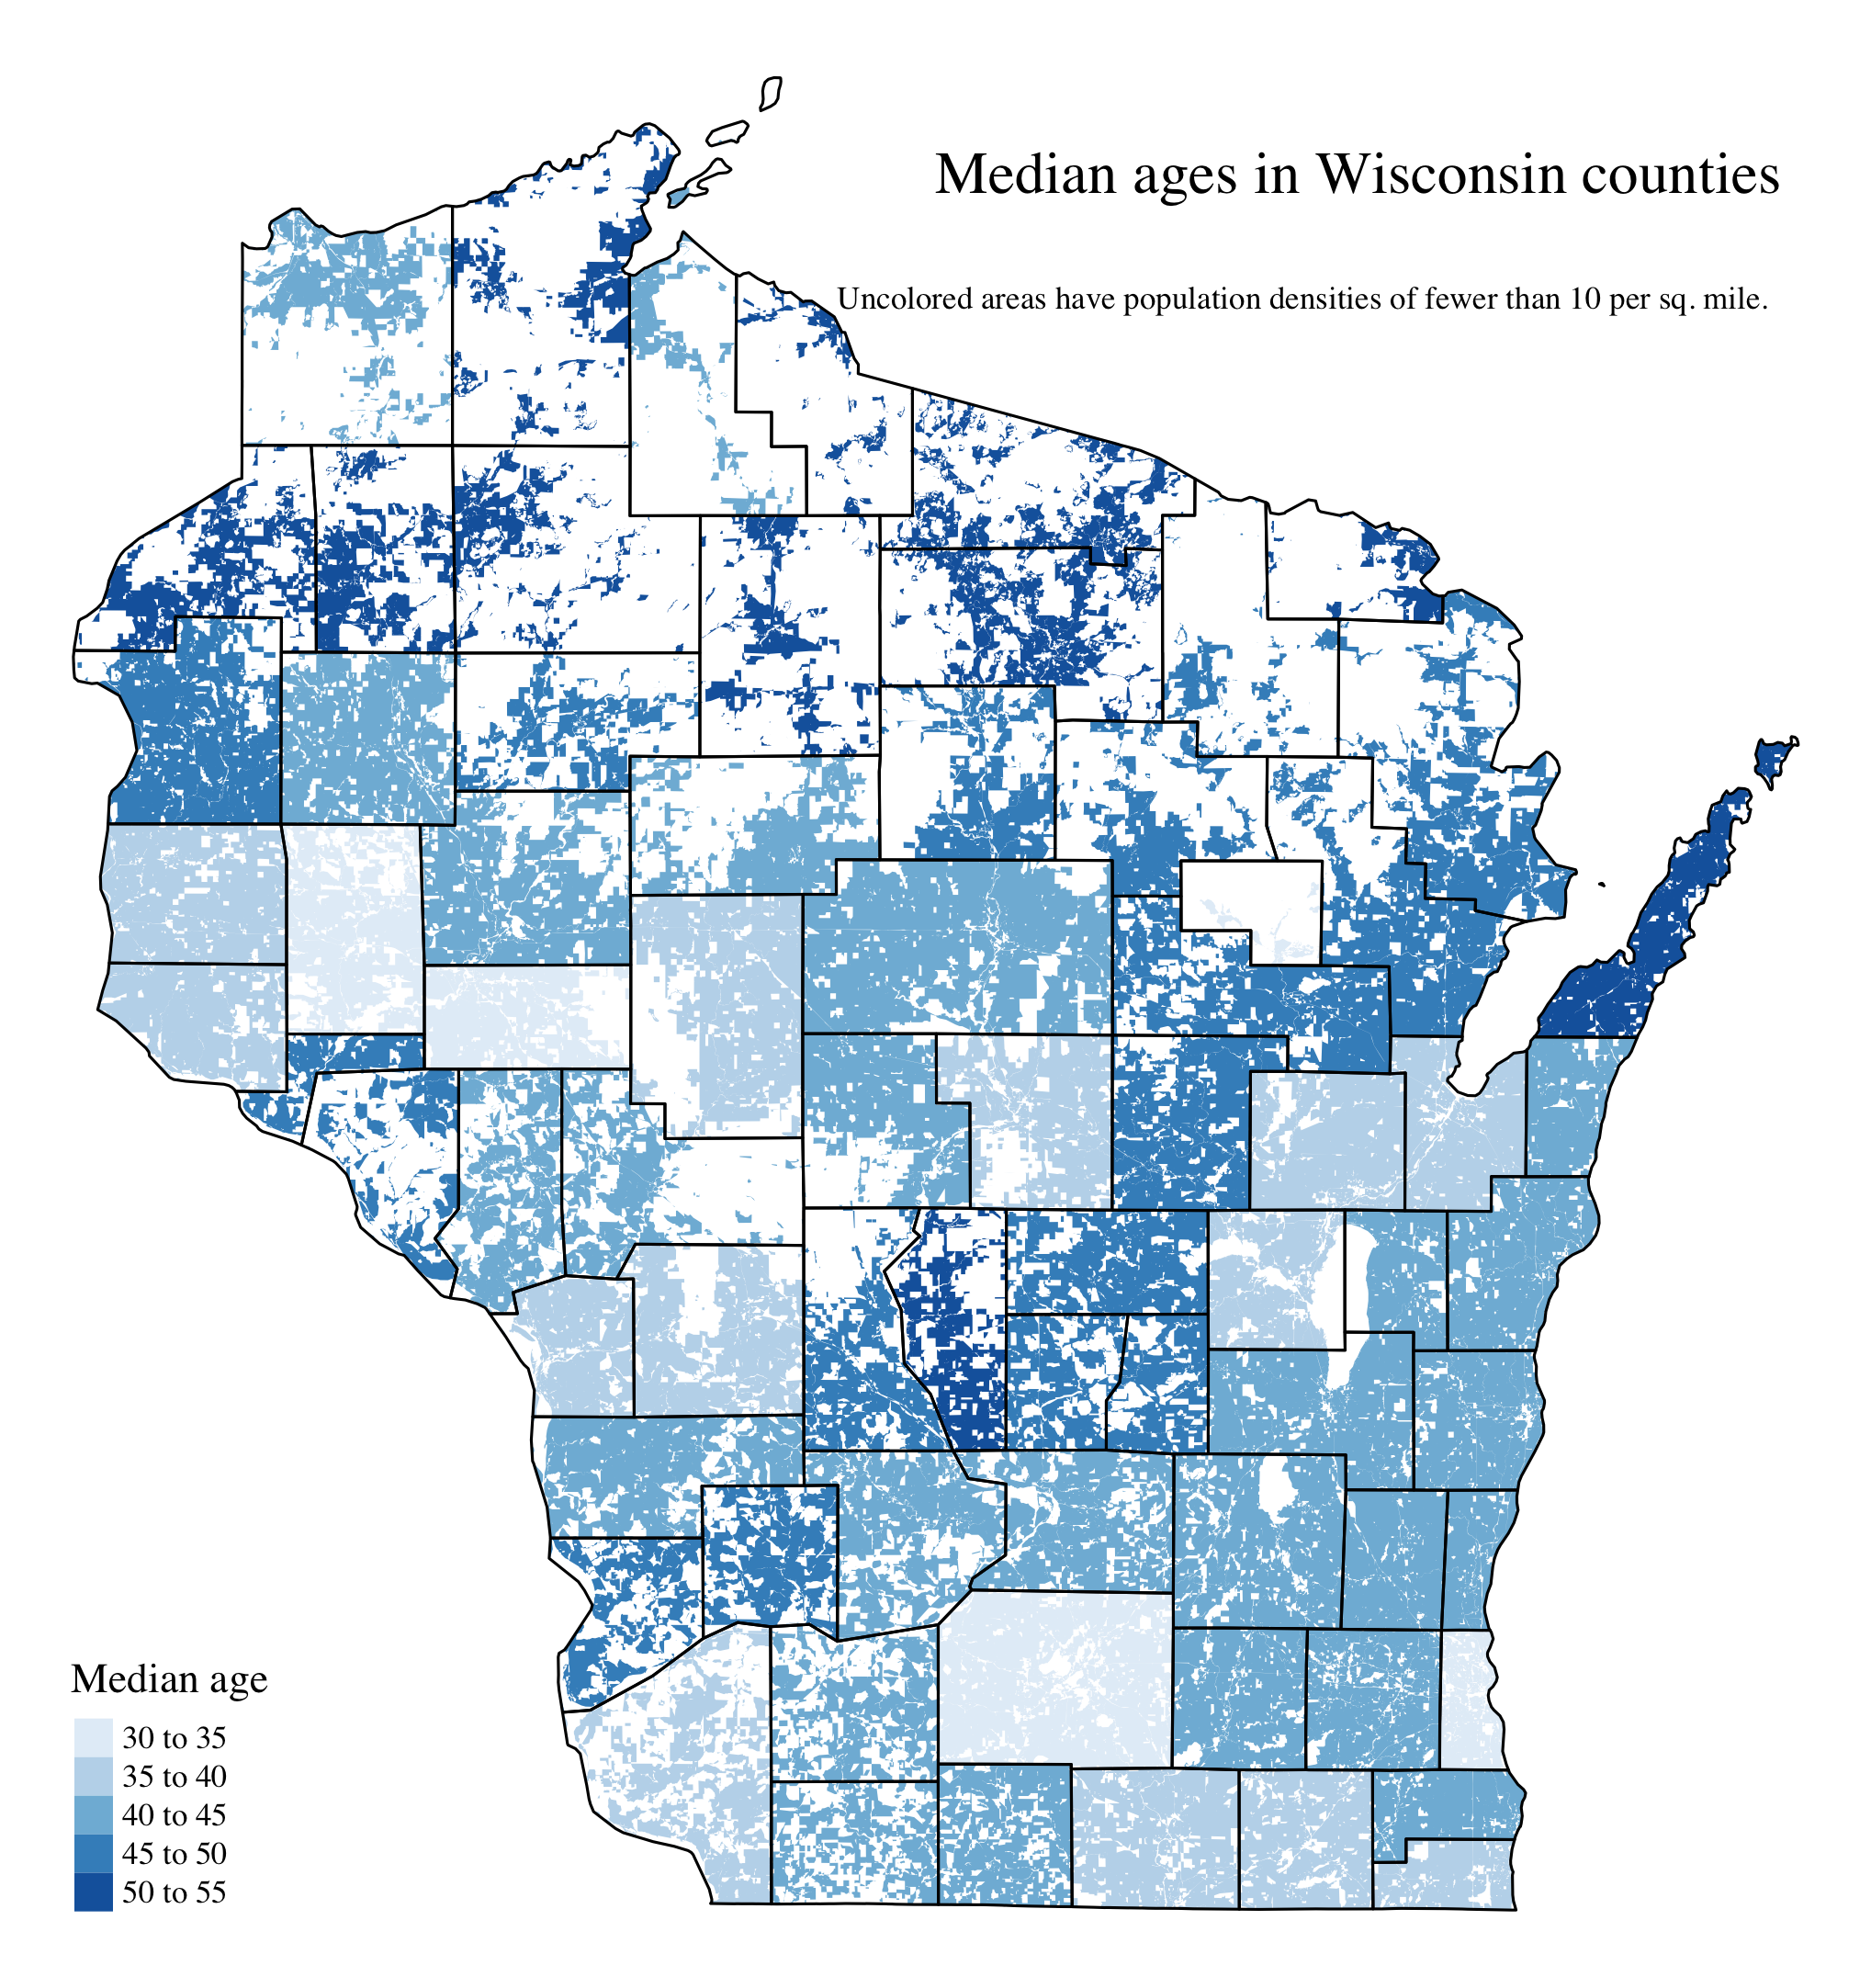
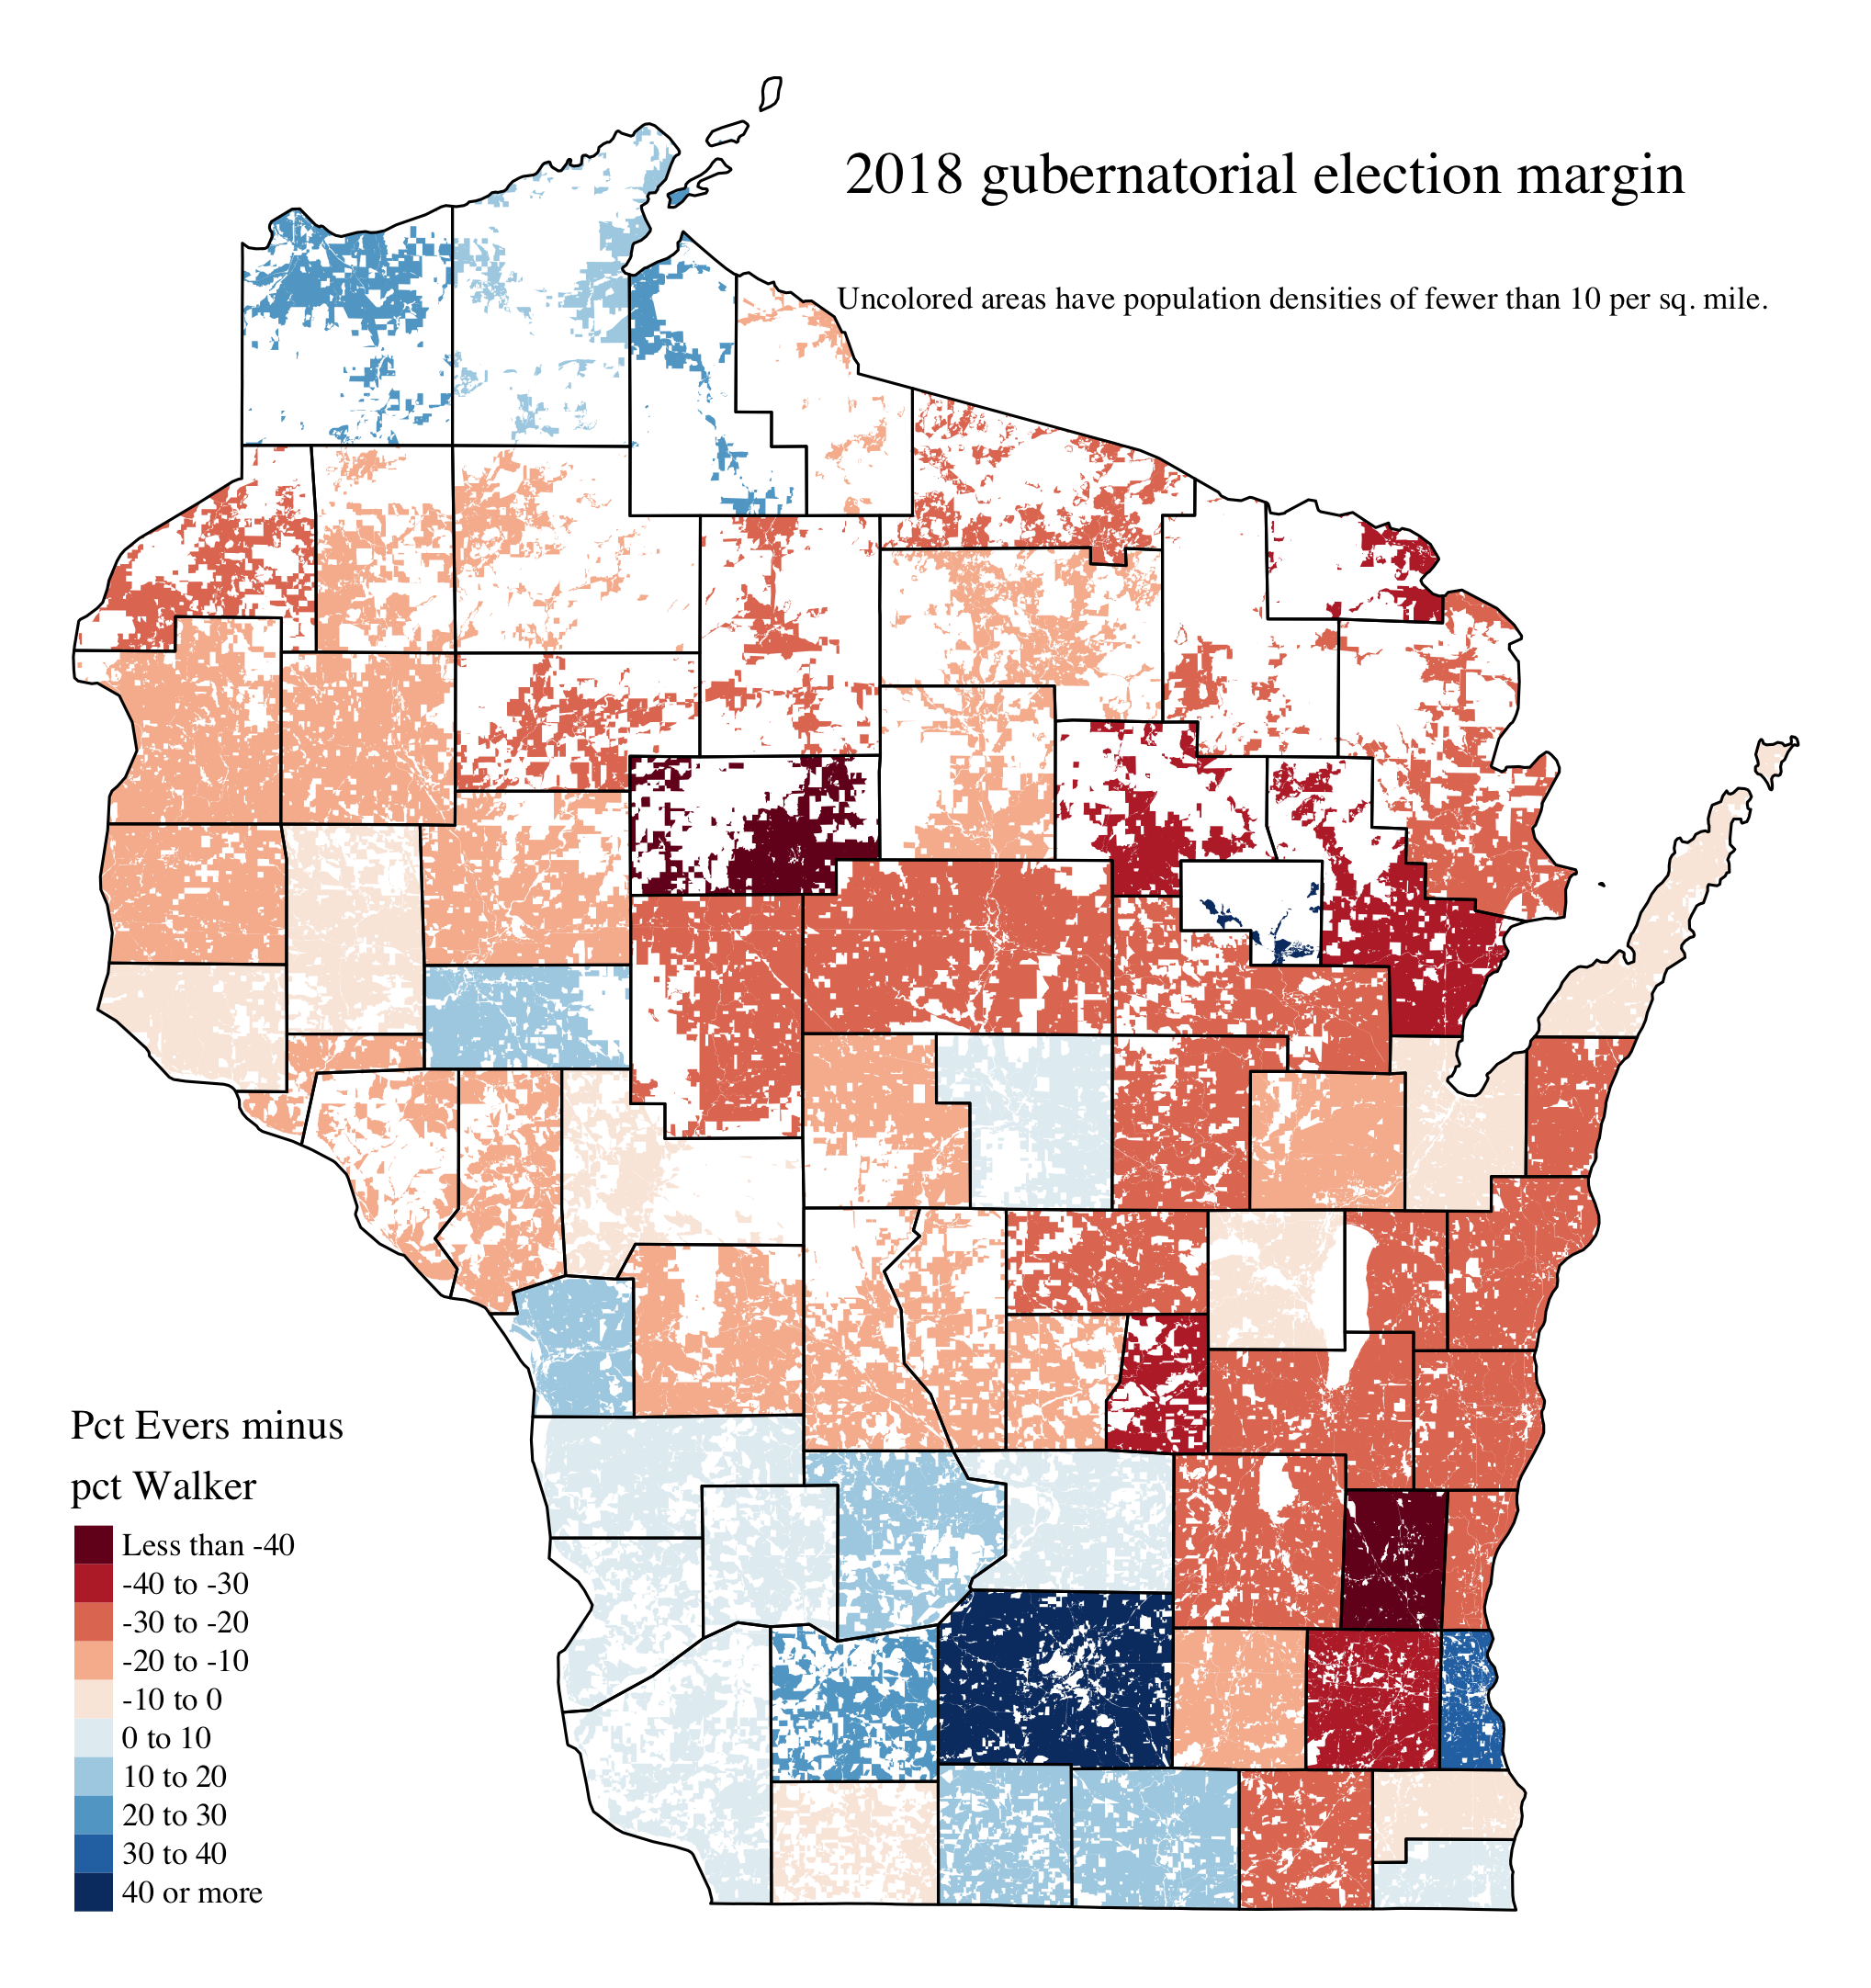
I decided to apply NYT’s idea to Wisconsin’s counties specifically. I believe NYT uses census tracts to build their map. I used 2010 census blocks instead. The 2010 Census divided Wisconsin into more than 250,000 tiny blocks–100,000 of them were completely unpopulated and another 10,000 had a population density of less than 10 per square mile. Removing all these blocks still leaves the 98.8% of the population intact.
Here is the resulting map. Unshaded regions either have no population or a population density of fewer than 10 people per square mile.
Download
If you’d like to download the county shapefile used to make the maps above, you can access it as a zip archive here. The zipped size is 1.7MB, and the unzipped shapefile is 2.5MB.