Analysis of Milwaukee County's Spring 2020 Election
Election summary
(winners in bold)
All of the following results are from the unofficial returns posted online by the Milwaukee County Election Commission.
Milwaukee County results
- Wisconsin Supreme Court Justice
- Jill Karofsky - 67%
- Daniel Kelly - 33%
- Democratic Presidential Primary
- Joe Biden - 58%
- Bernie Sanders - 36%
- County Executive
- David Crowley - 50%
- Chris Larson - 50%
Milwaukee City results
- Milwaukee Mayor
- Tom Barrett - 63%
- Lena Taylor - 37%
- City Attorney
- Tearman Spencer - 61%
- Grant Langley - 39%
- City Comptroller
- Aycha Sawa - 50%
- Jason Fields - 49%
- City Treasurer
- Spencer Coggs - 67%
- Brandon Methu - 33%
- Milwaukee Public Schools Referendum
- Yes - 78%
- No - 22%
Election detail
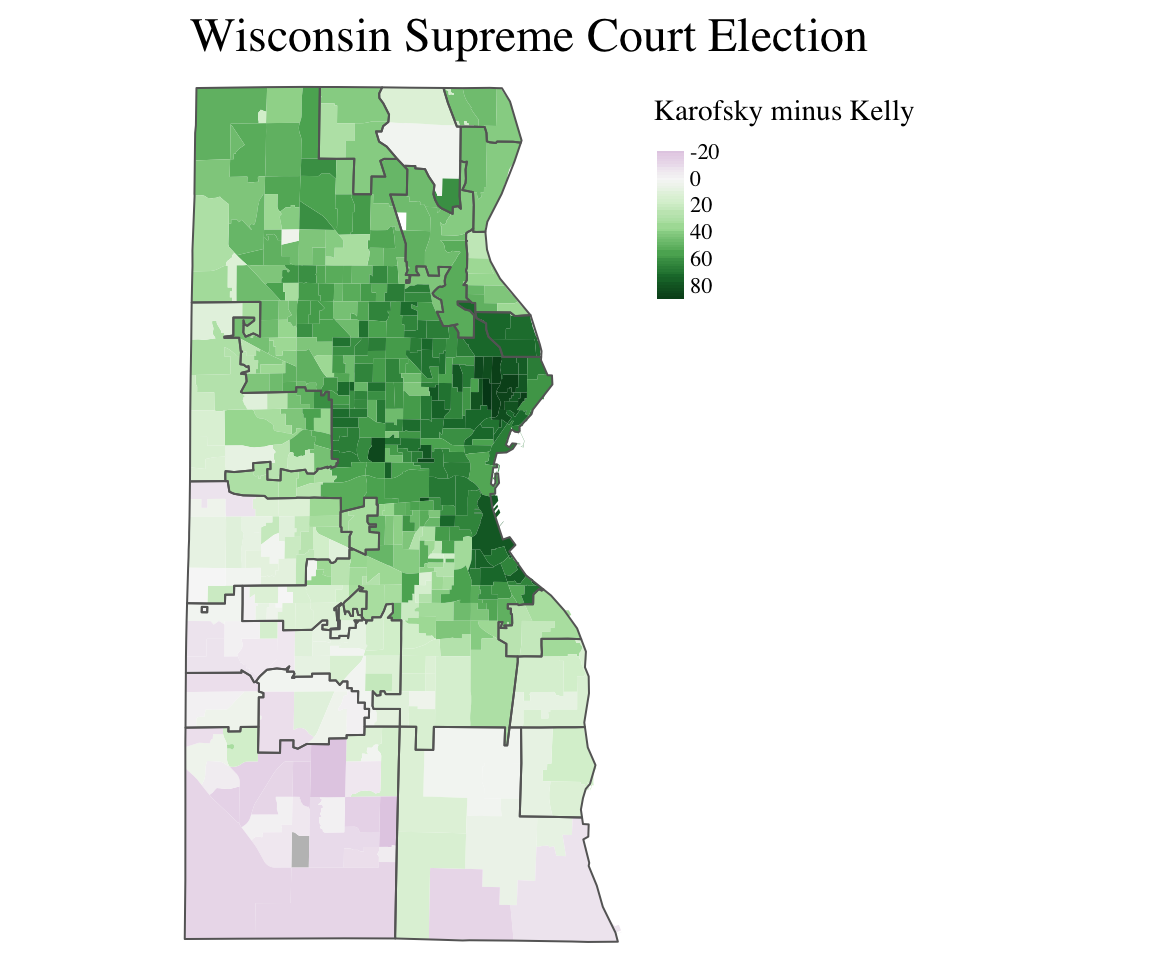
Wisconsin Supreme Court
Jill Karofsky won Milwaukee County easily, carrying the City of Milwaukee and 16/18 suburbs. Kelly did best in the suburbs to the south of Milwaukee County where he won Franklin and Hales Corners. Karofsky’s largest victory was in Shorewood. This most reliably Democratic municipality in Wisconsin gave her 86% of the vote. In fact, all of her greatest victories (apart from the City of Milwaukee) came in the wealthy North Shore suburbs. She got more than 70% of the vote in Fox Point, Bayside, Glendale, and Shorewood.
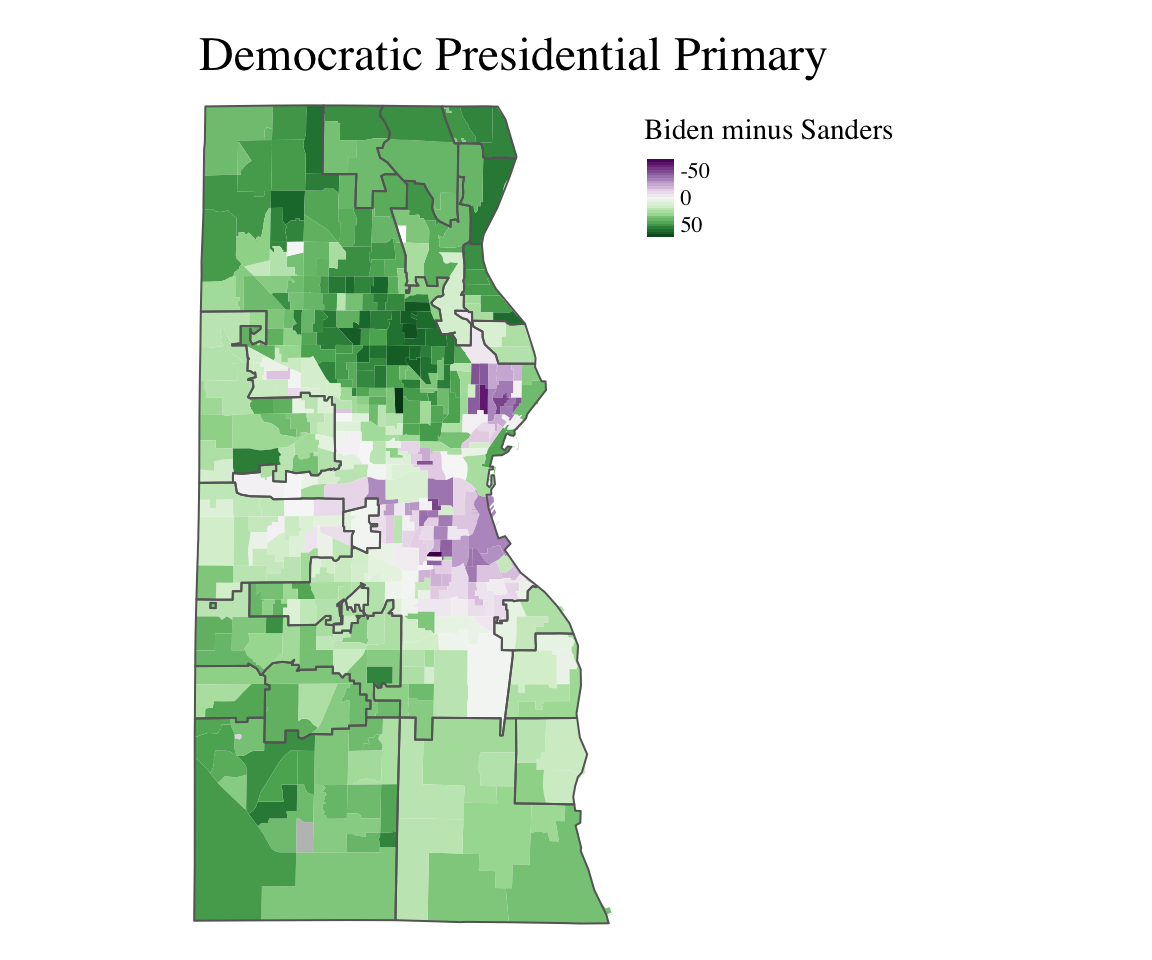
Democratic Presidential Primary
Bernie Sanders almost won Milwaukee County in 2016. He got 48% of the vote compared to Clinton’s 52%. This year, his share fell to just 36% and he won 0 municipalities. His best performances came in the two primarily white (with significant Latino minorities) working class suburbs of West Milwaukee (44%) and West Allis (41%). He did worst in the likewise predominately white, but quite wealthy North Shore suburbs of Bayside, Fox Point, River Hills, and Whitefish Bay. Within Milwaukee, Sanders won Riverwest, much of the East Side, Bay View, and large parts of the predominately Latino Near South Side.
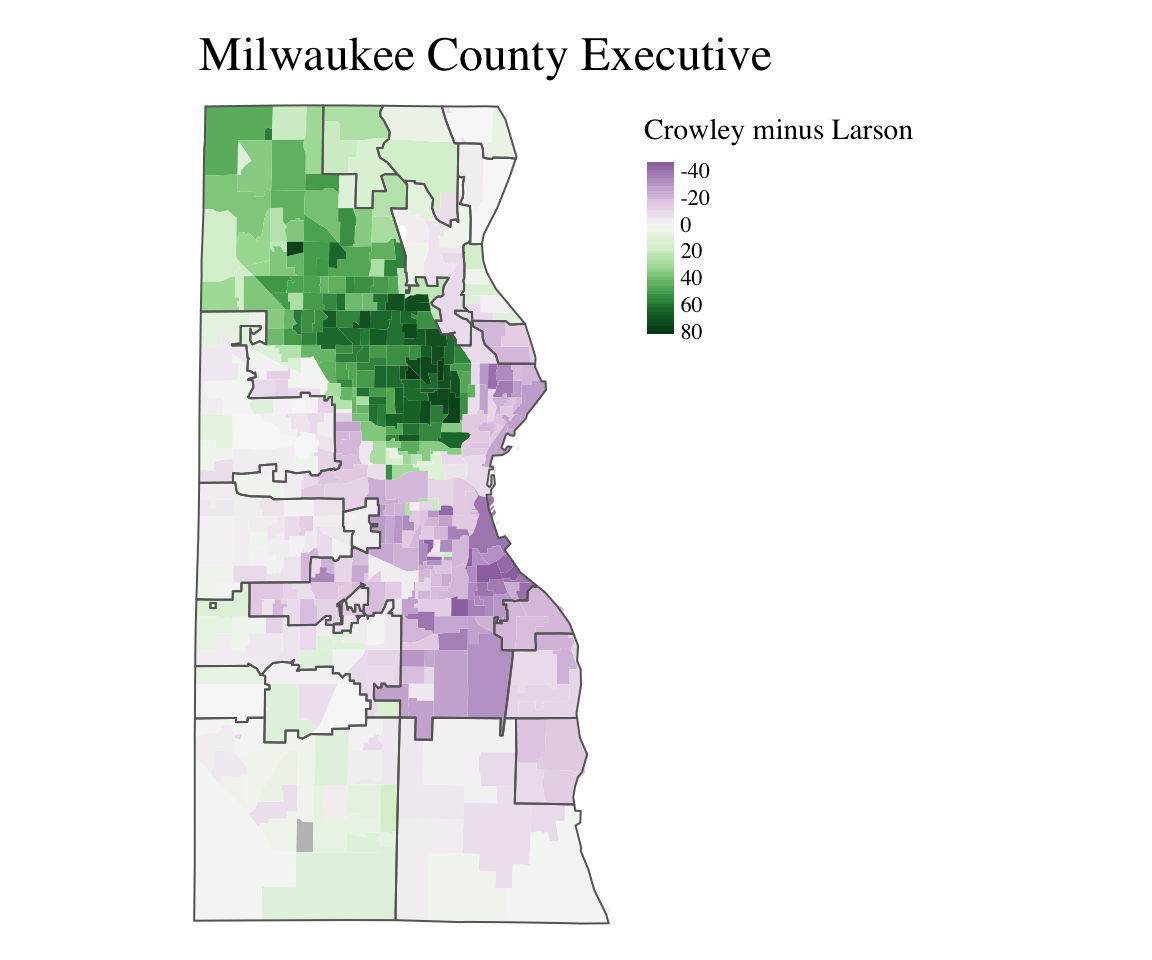
County Executive
The race for Milwaukee County Executive was the closest on the ballot. David Crowley defeated Chris Larson by just over 1,000 votes. Both men are Democratic state legislators, but Crowley ran as the more moderate choice while Larson is an avowed progressive. This led to an unusual set of coalitions for Milwaukee County. David Crowley overwhelming carried his political base on Milwaukee’s North and Northwest Sides. To this he added victories in Brown Deer, River Hills, Whitefish Bay, Hales Corners, Bayside, Franklin, and Greendale. Larson won the rest of the City of Milwaukee, but with less overwhelming support. He also won victories in St. Francis, Shorewood, Cudahy, South Milwaukee, West Allis, (and narrowly in) Oak Creek, West Milwaukee, Wauwatosa, Greenfield, and Fox Point.
Milwaukee Mayor
Tom Barrett won reelection to his fifth consecutive term as mayor handily, despite State Senator Lena Taylor’s strong performance on the North Side of Milwaukee.
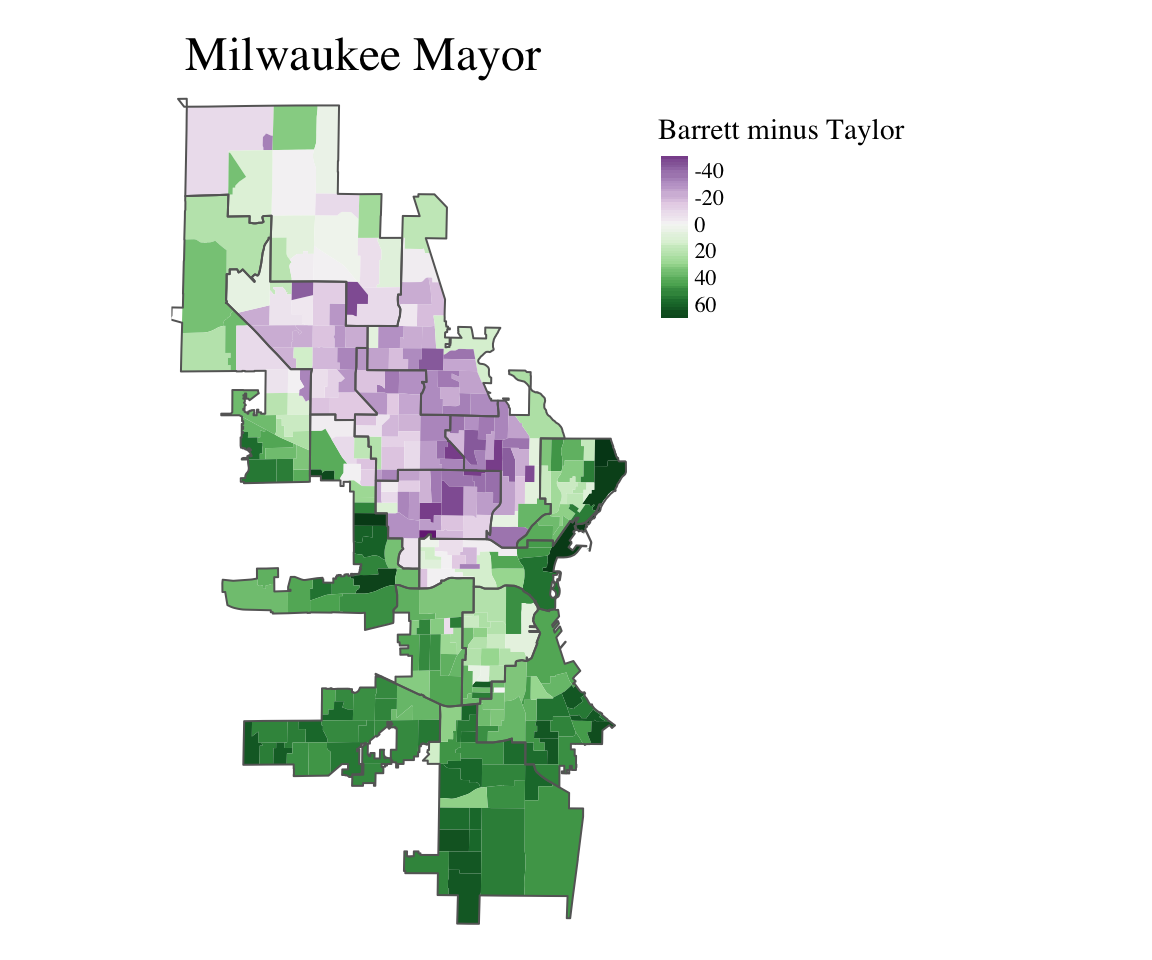
Milwaukee racial segregation is a depressingly inescable fact in nearly of all of these maps. Readers may have noticed that neither Lena Taylor and David Crowley, both African Americans, won many City of Milwaukee wards that didn’t also have a black majority. I calculate that 127 of Milwaukee’s 324 wards have a non-Hispanic white majority. Crowley won 16 of them and, Taylor won 2.
Despite this, David Crowley still managed to win a majority of the city’s vote (52% to Larson’s 48%), while Taylor ran far behind him, winning just 37% of the citywide vote. This is because Crowley won an exceedingly large share of the vote in majority black wards (75%) while minimizing his loses in the majority white parts of the city where he got 40% of the vote. See the table below for details.
| Ward majority | Lena Taylor | Tom Barrett | Chris Larson | David Crowley |
|---|---|---|---|---|
| Asian | 79.3 | 20.7 | 21.4 | 78.6 |
| Black | 56.1 | 43.3 | 25.0 | 74.8 |
| Latino | 33.2 | 65.7 | 60.9 | 38.6 |
| No Majority | 41.7 | 57.3 | 42.5 | 57.2 |
| White | 26.2 | 72.7 | 59.2 | 40.4 |
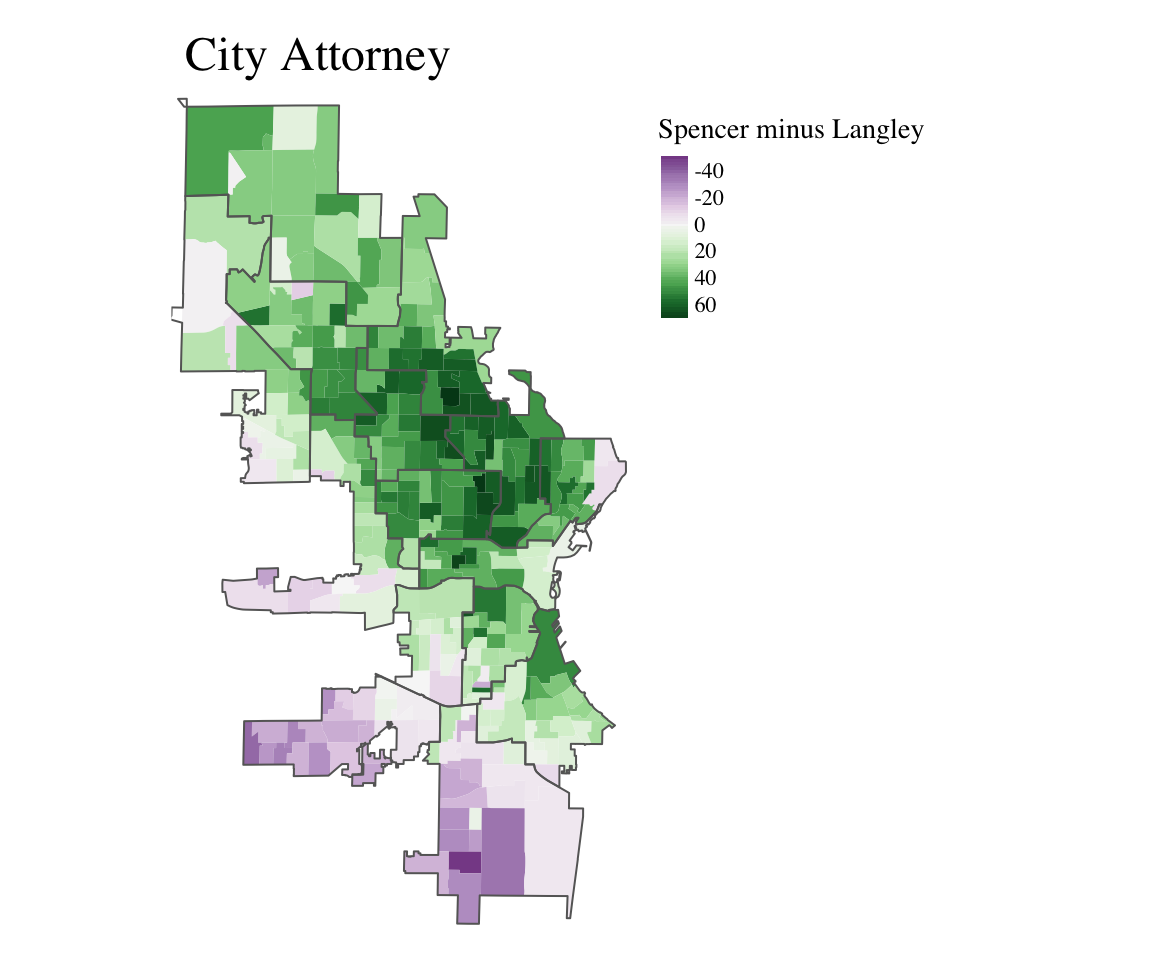
City Attorney
The typically low-profile office of City Attorney wound up being an unusually interesting campaign. Challenger Tearman Spencer soundly defeated incumbent Grant Langley (first elected in 1984) by a vote of 61% to 39%. What’s more, Spencer finished the campaign while fighting a case of COVID-19.
The map below shows how Spencer racked up such a large margin of victory. He won the predominately African American north side of Milwaukee, the majority white neighborhoods along the Lake, and the majority Latino South Side. Langley only received a majority of the vote in the traditionally ethnic white far South, and Southwest Sides.
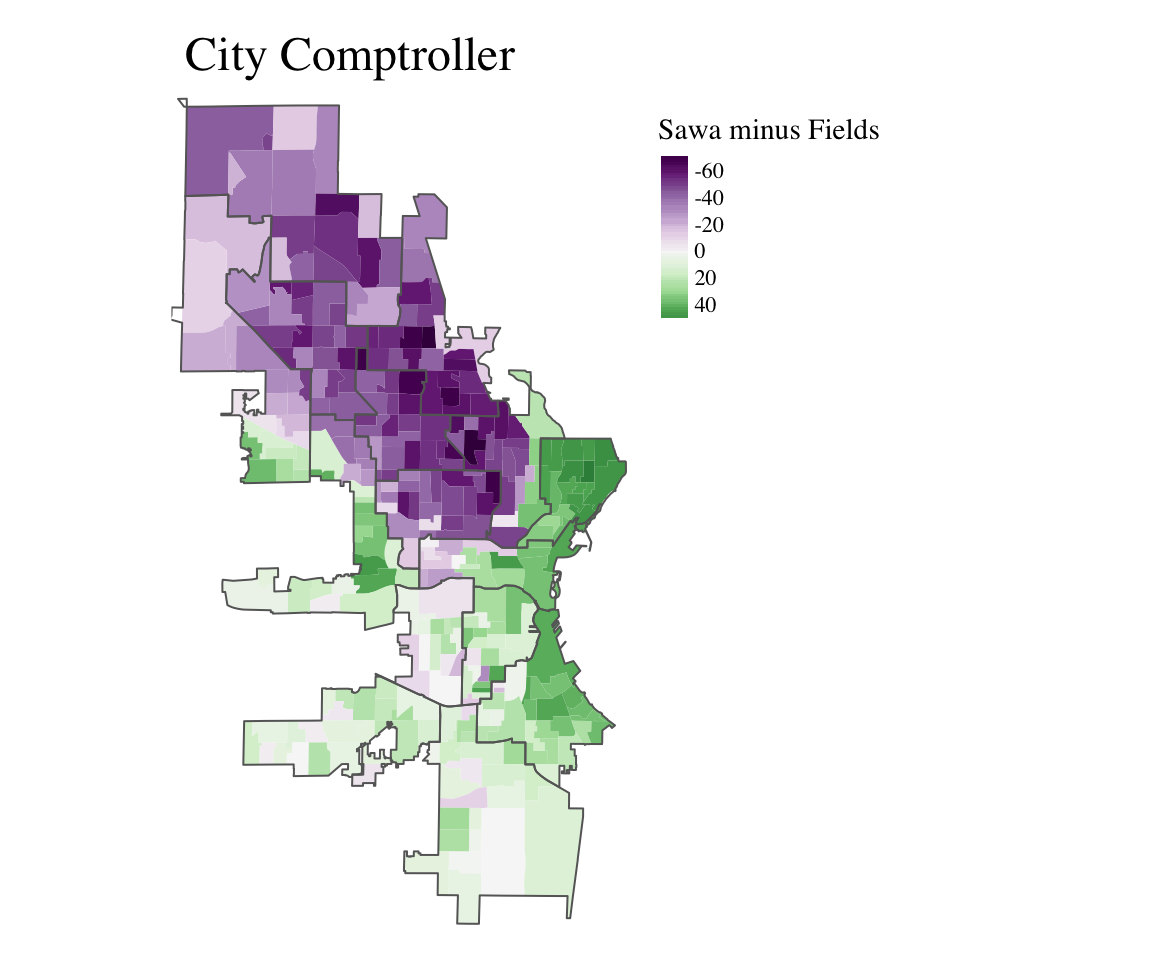
City Comptroller
The retirement of another longtime incumbent left the City Comptroller’s seat open. Current Deputy Comptroller Aycha Sawa narrowly defeated State Legislator Jason Fields 50% to 49%.
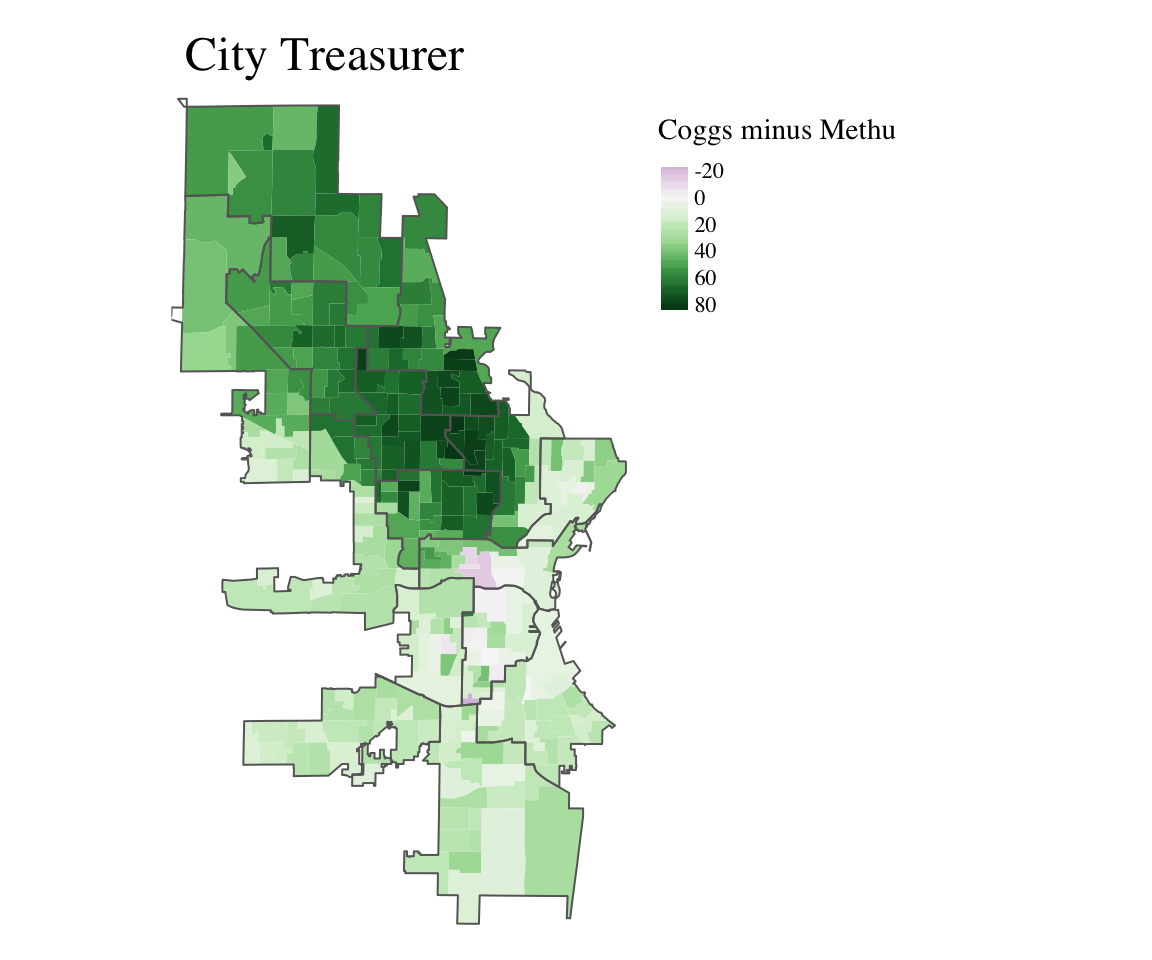
City Treasurer
The City Treasurer’s race was a largely uneventful affair. The incumbent, Spencer Coggs, easily won reelection despite token opposition from challenger Brandon Methu, who won just 10 out of 324 wards.
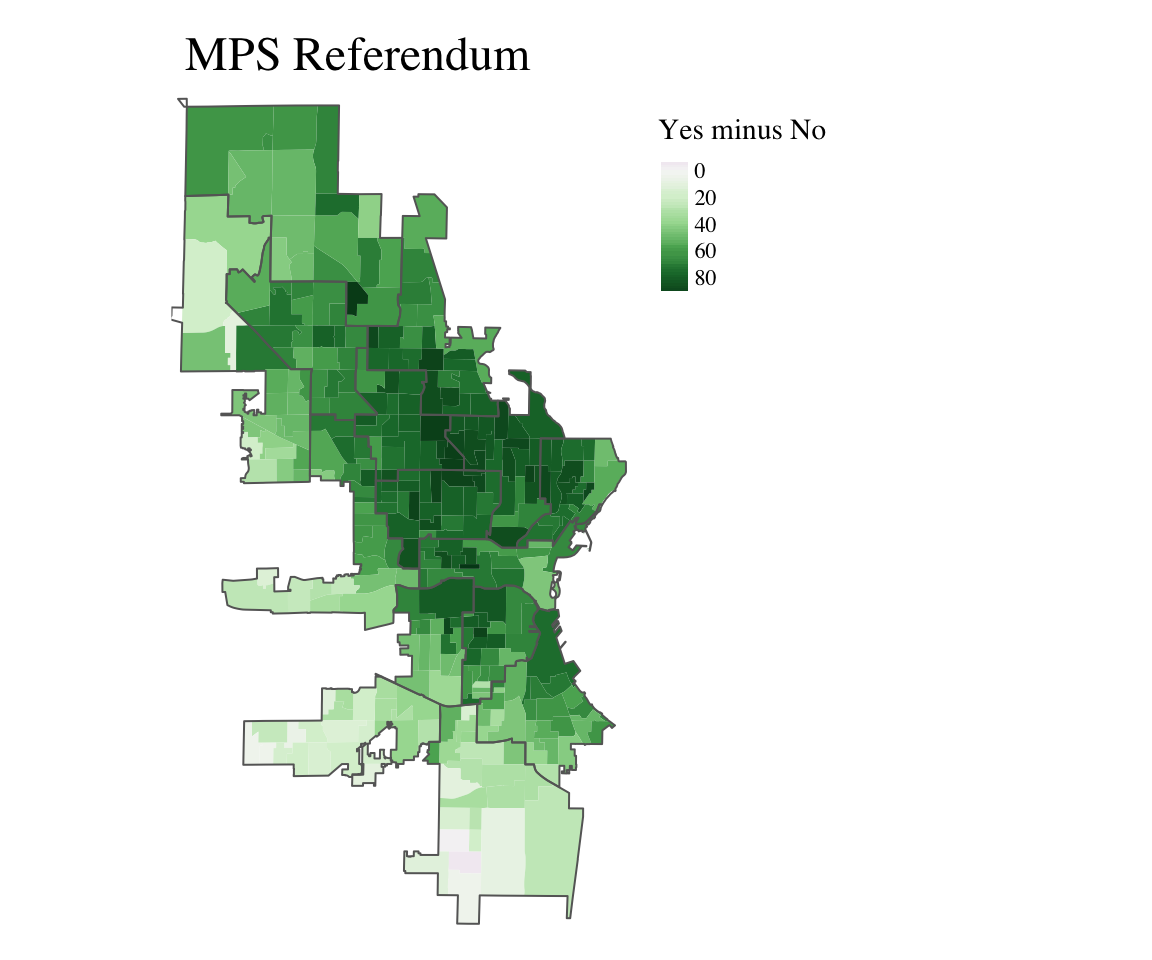
MPS Referendum
The most unifying issue on the ballot proved to be the Milwaukee Public Schools referendum to raise property taxes. It received 78% of the vote citywide and carried every aldermanic district with at least 61% of the vote. Only 2 wards in the entire city voted against it.
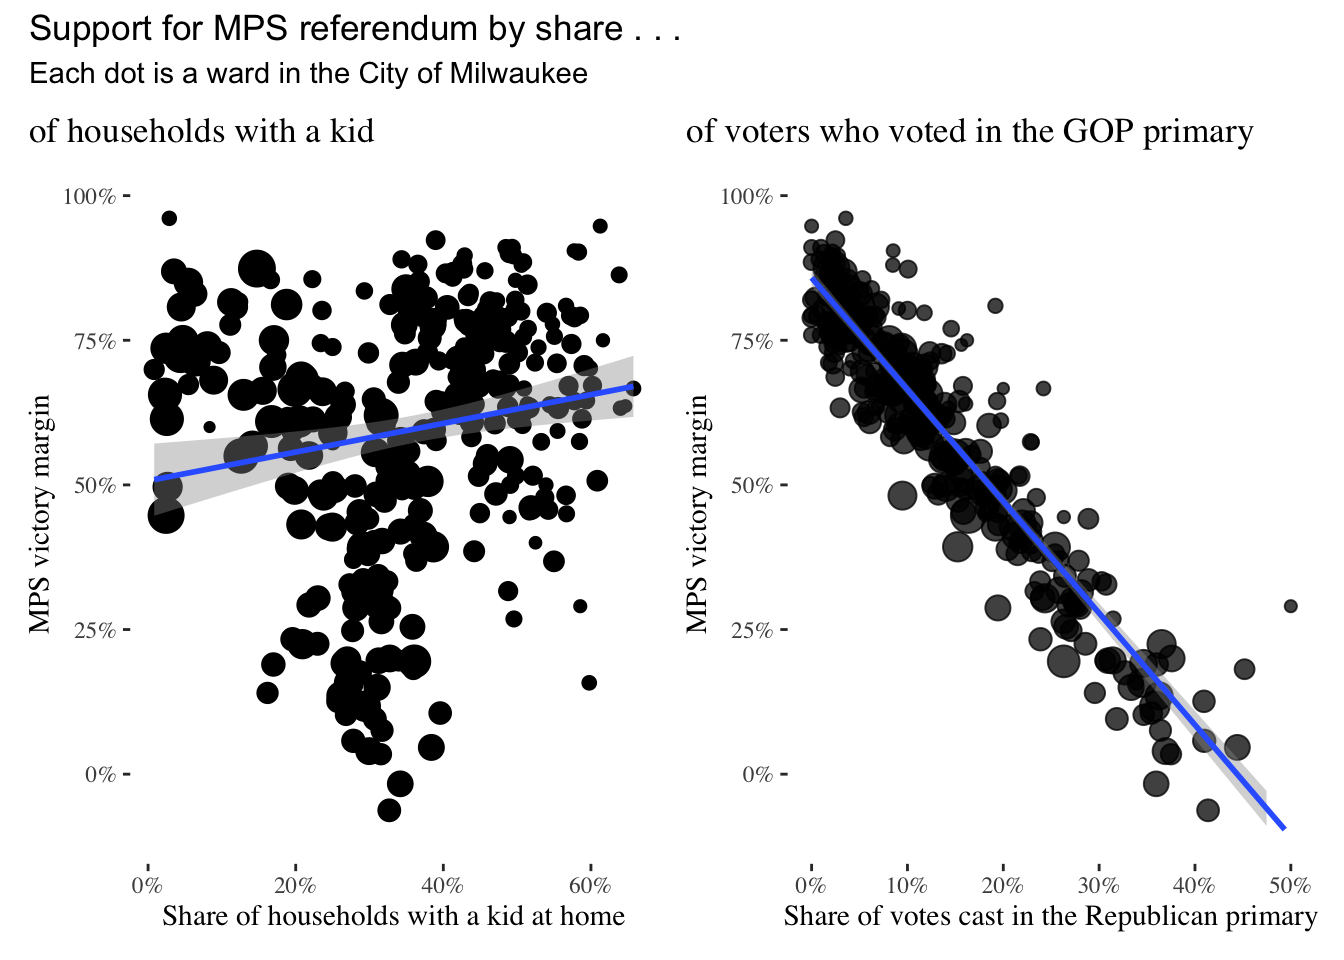
There was little or no relationship between the share of households with a child at home and support for the MPS referendum. Support was basically the same in neighborhoods with few children as it was it neighborhoods where half of homes have kids.
The number of Republican voters in a ward did have a remarkably strong negative correlation with support for the referendum. The MPS referendum’s victory margin decline by about 2 points for every additional 1% increase in Republican primary participation.
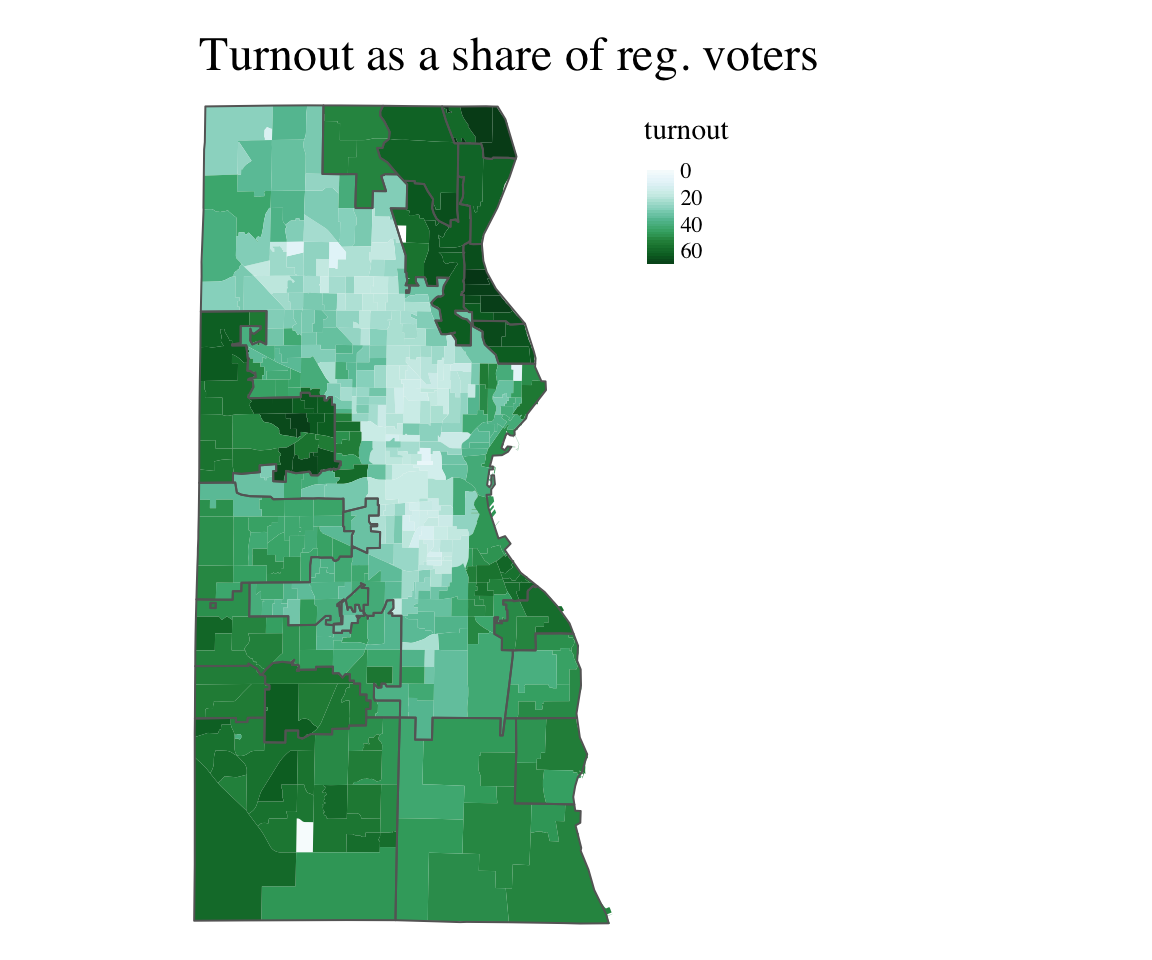
Turnout
The April 2020 election was extremely irregular. It took place during a global pandemic. Many thousands of citizens voted absentee, but serious problems were revealed with the postal service. Some ballots were never delivered. Others were delivered without postmarks. An unknown number were delivered too late or never delivered at all. By the time election day came around, the City of Milwaukee only offered 5 polling places. Voters waited in line for hours. Anectdotal reports in the New York Times suggest suburban voters experienced essential no disruptions.
A full accounting of voter turnout will have to wait, but the table and map below display voter turnout rates, as a share of registered voters, in the Spring 2020 election. Turnout was highest in Whitefish Bay and Bayside, both of which mailed an absentee ballot application to each registered voter in their boundaries. Turnout in these two communities was double that of the City of Milwaukee, where only 32% of registered voters cast a ballot.