How Accurate is ACS 5-Year Data?
Census estimates versus municipal full counts
Since 2005, the Census Bureau has provided detailed demographic, economic, and property data through its American Community Survey (ACS) program. Data collection is ongoing, but estimates for small geographies are only released as 5-year modelled averages. Currently, the most recent vintage is 2012-2016.
Sometimes things estimated by the ACS are also measured by other institutions. The Milwaukee Assessor’s Office maintains a regularly updated “Master Property List” dataset (MPROP) which contains detailed property records for every parcel of land in the city. Unlike the ACS, MPROP is not an estimate. It’s more akin to a true census, since information is collected for each bit of property individually. Like any dataset, it’s still subject to various kinds of human error, but it avoids the sampling error inherent in the ACS.
By comparing ACS property estimates with MPROP property full counts, we can accurately measure the amount of sampling error contained in the ACS.
The smallest geography at which Census data is available is the block group. There are 564 census block groups located entirely within the City of Milwaukee. The analysis below looks at a simple measure–the total number of residential housing units within each block group. Because the ACS data is a multi-year estimate, I generate a comparable MPROP 5-year average by taking the mean number of units in each block group for the years 2012-2016.
So, how good is the ACS?
The short answer is pretty darn good.
Overall, the census estimates 255,022 total housing units. This is 2,653 units more than the MPROP total of 252,369. That’s just a shade over 1% off the “real” MPROP number.
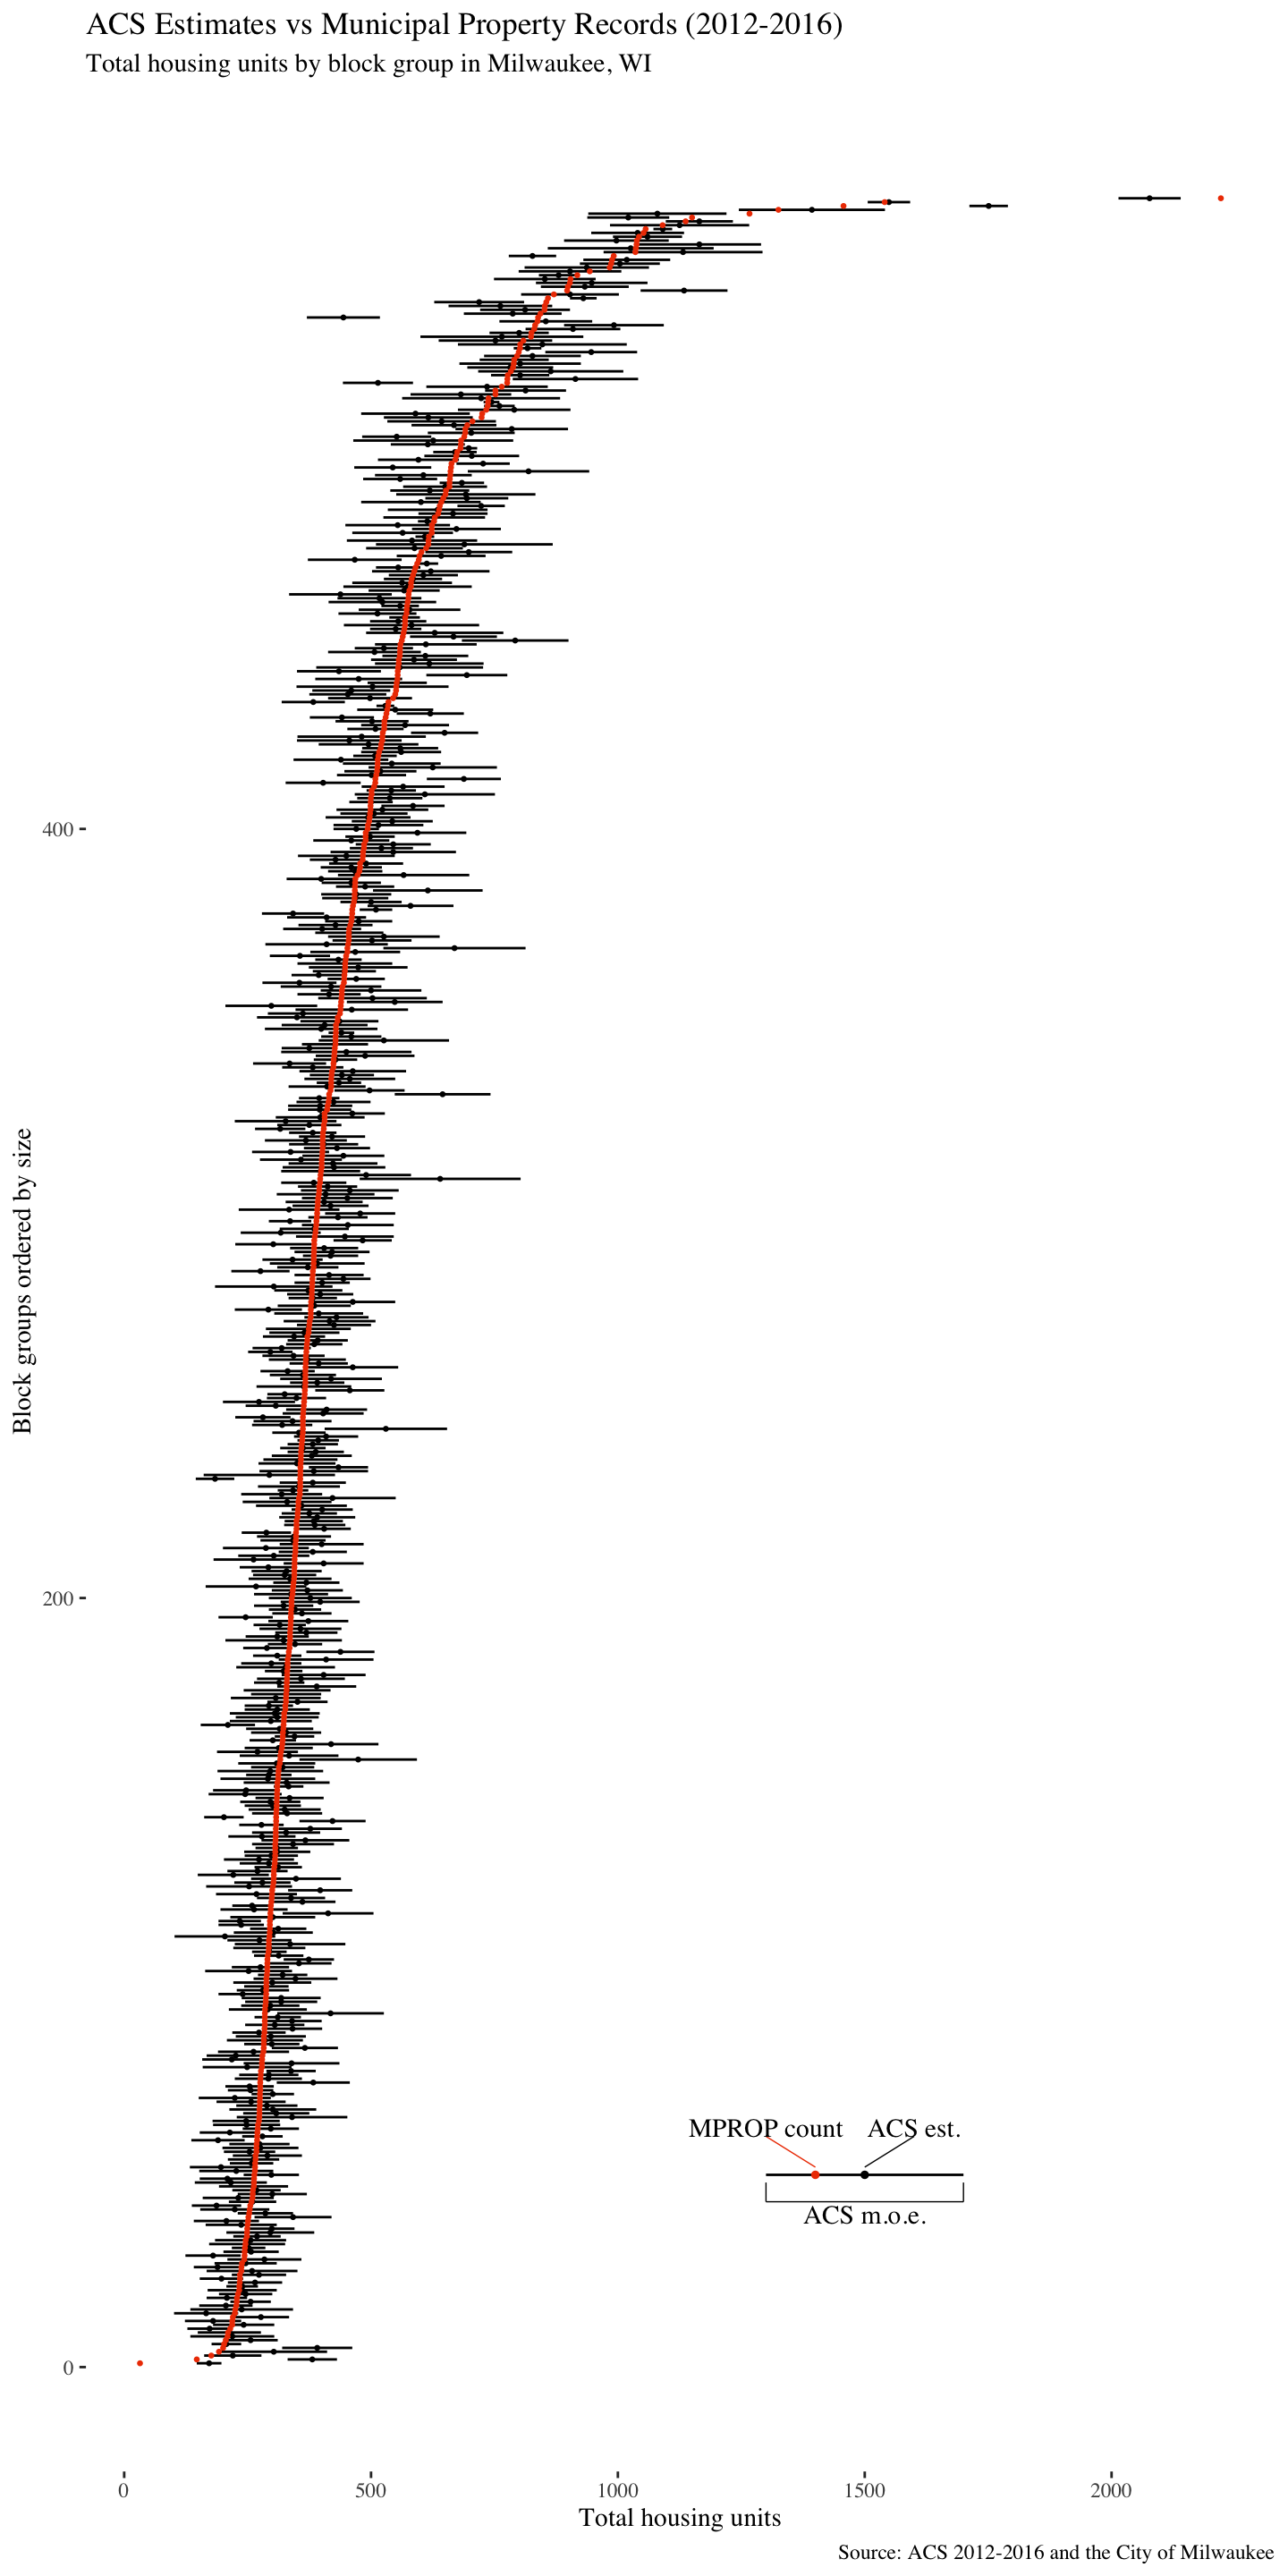
Of course, the individual block groups have much smaller sample sizes and much larger errors. The graph below shows the two measures for each census block along with the margin of error provided by the Census Bureau.
Census errors do not skew significantly in one direction or another. The average error for all 564 block groups is -2.4%, or 4.7 units too few. The average absolute error is 12.0% of the actual number of units, or 46 units. (This is using MPROP as the denominator).
As shown below, the Census Bureau provides a margin of error for each estimate based on a 90% confidence interval. This means that over the course of a large sample, the real number should fall within the ACS margin of error 90% of the time. This is indeed the case. In 90.1% of cases, the MPROP residential unit count falls within the margin of error established by the ACS estimate.
Comparison of the ACS and the decennial census
The decennial census also collects housing data. Because it attempts to be a full count, there is no sampling margin of error provided. Theoretically, this data is more accurate than ACS estimates.
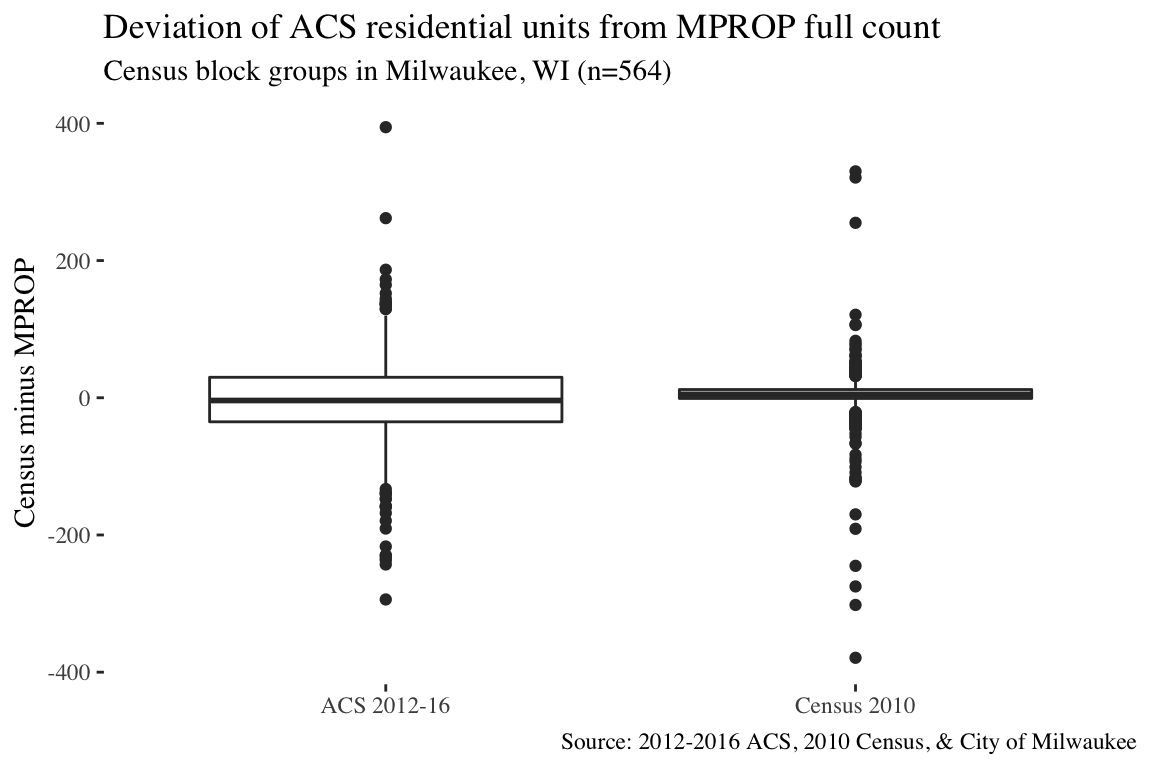
Here is a boxplot of the differences between MPROP and Census numbers. The mean difference between the 2010 census and the MPROP count is 3.0 units with a standard deviation of 43.2. By comparison, the 2012-2016 ACS figures has a mean difference of -4.7 units with a standard deviation of 65.2.
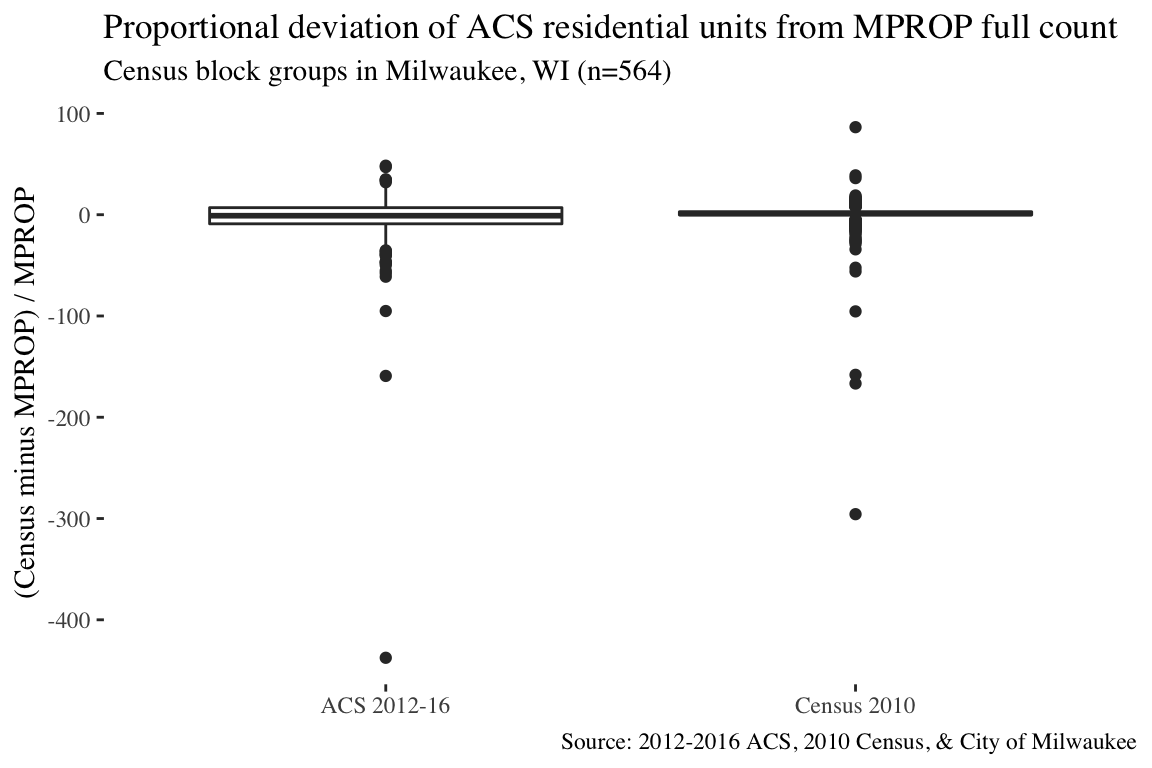
Here is the same boxplot, but for percentage differences.