Libraries & intergenerational income mobility
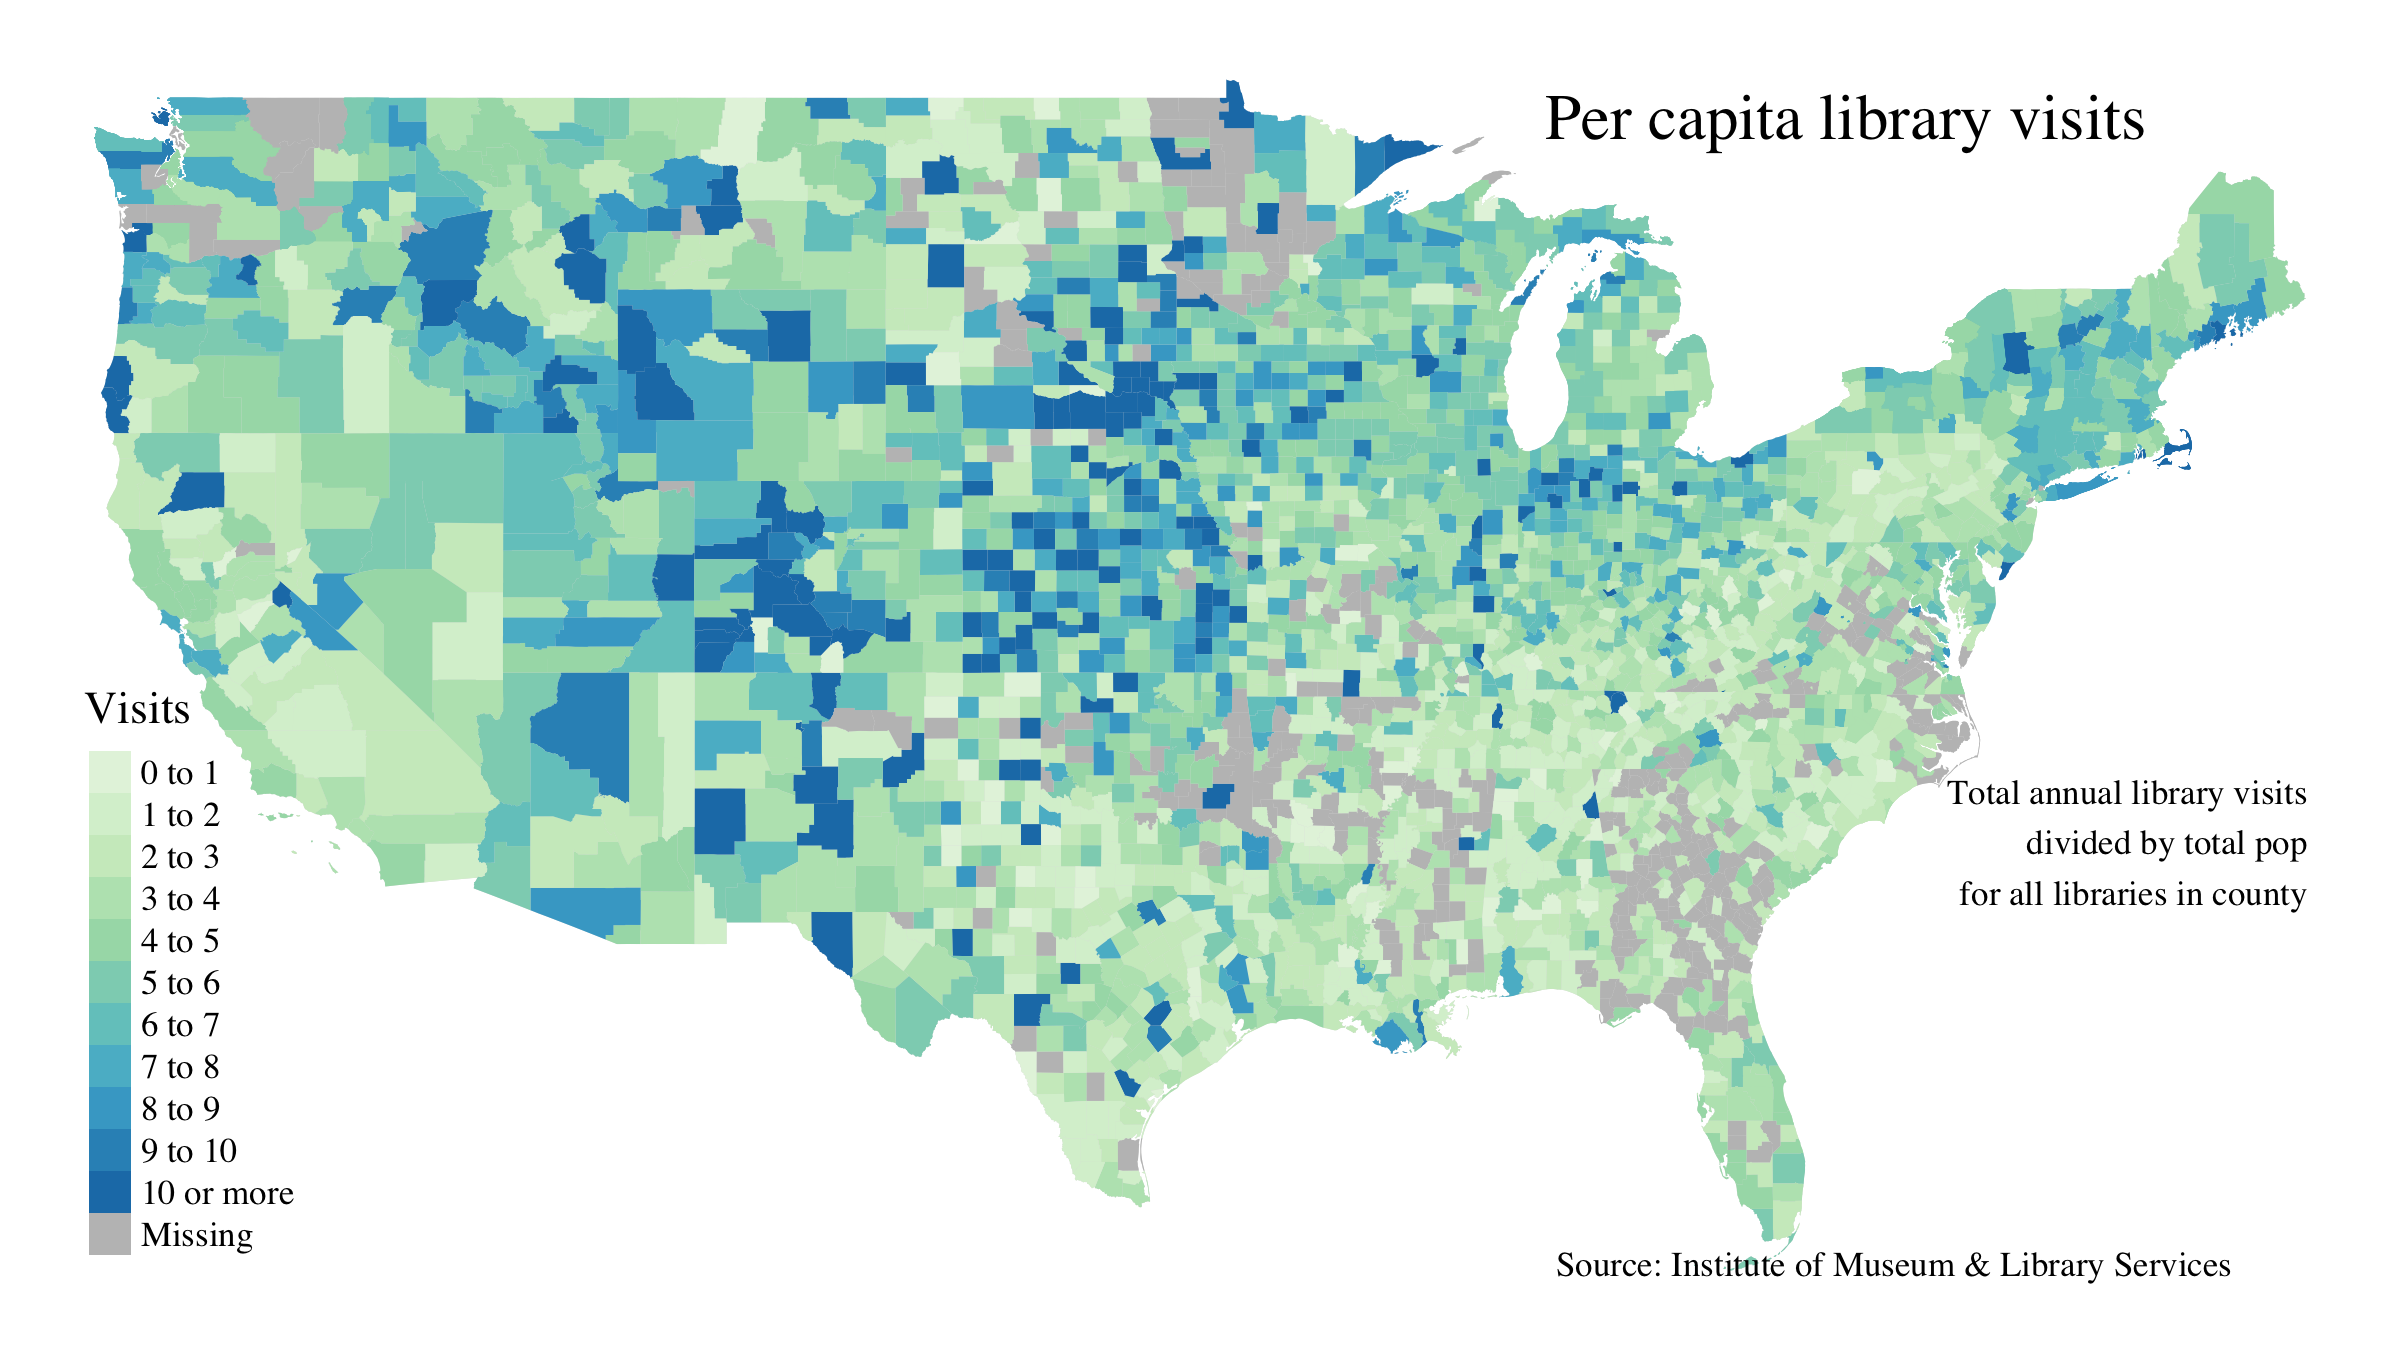
Here’s a map of county per capita annual library visits across the United States.1 This data covers the fiscal year ending July 2017.
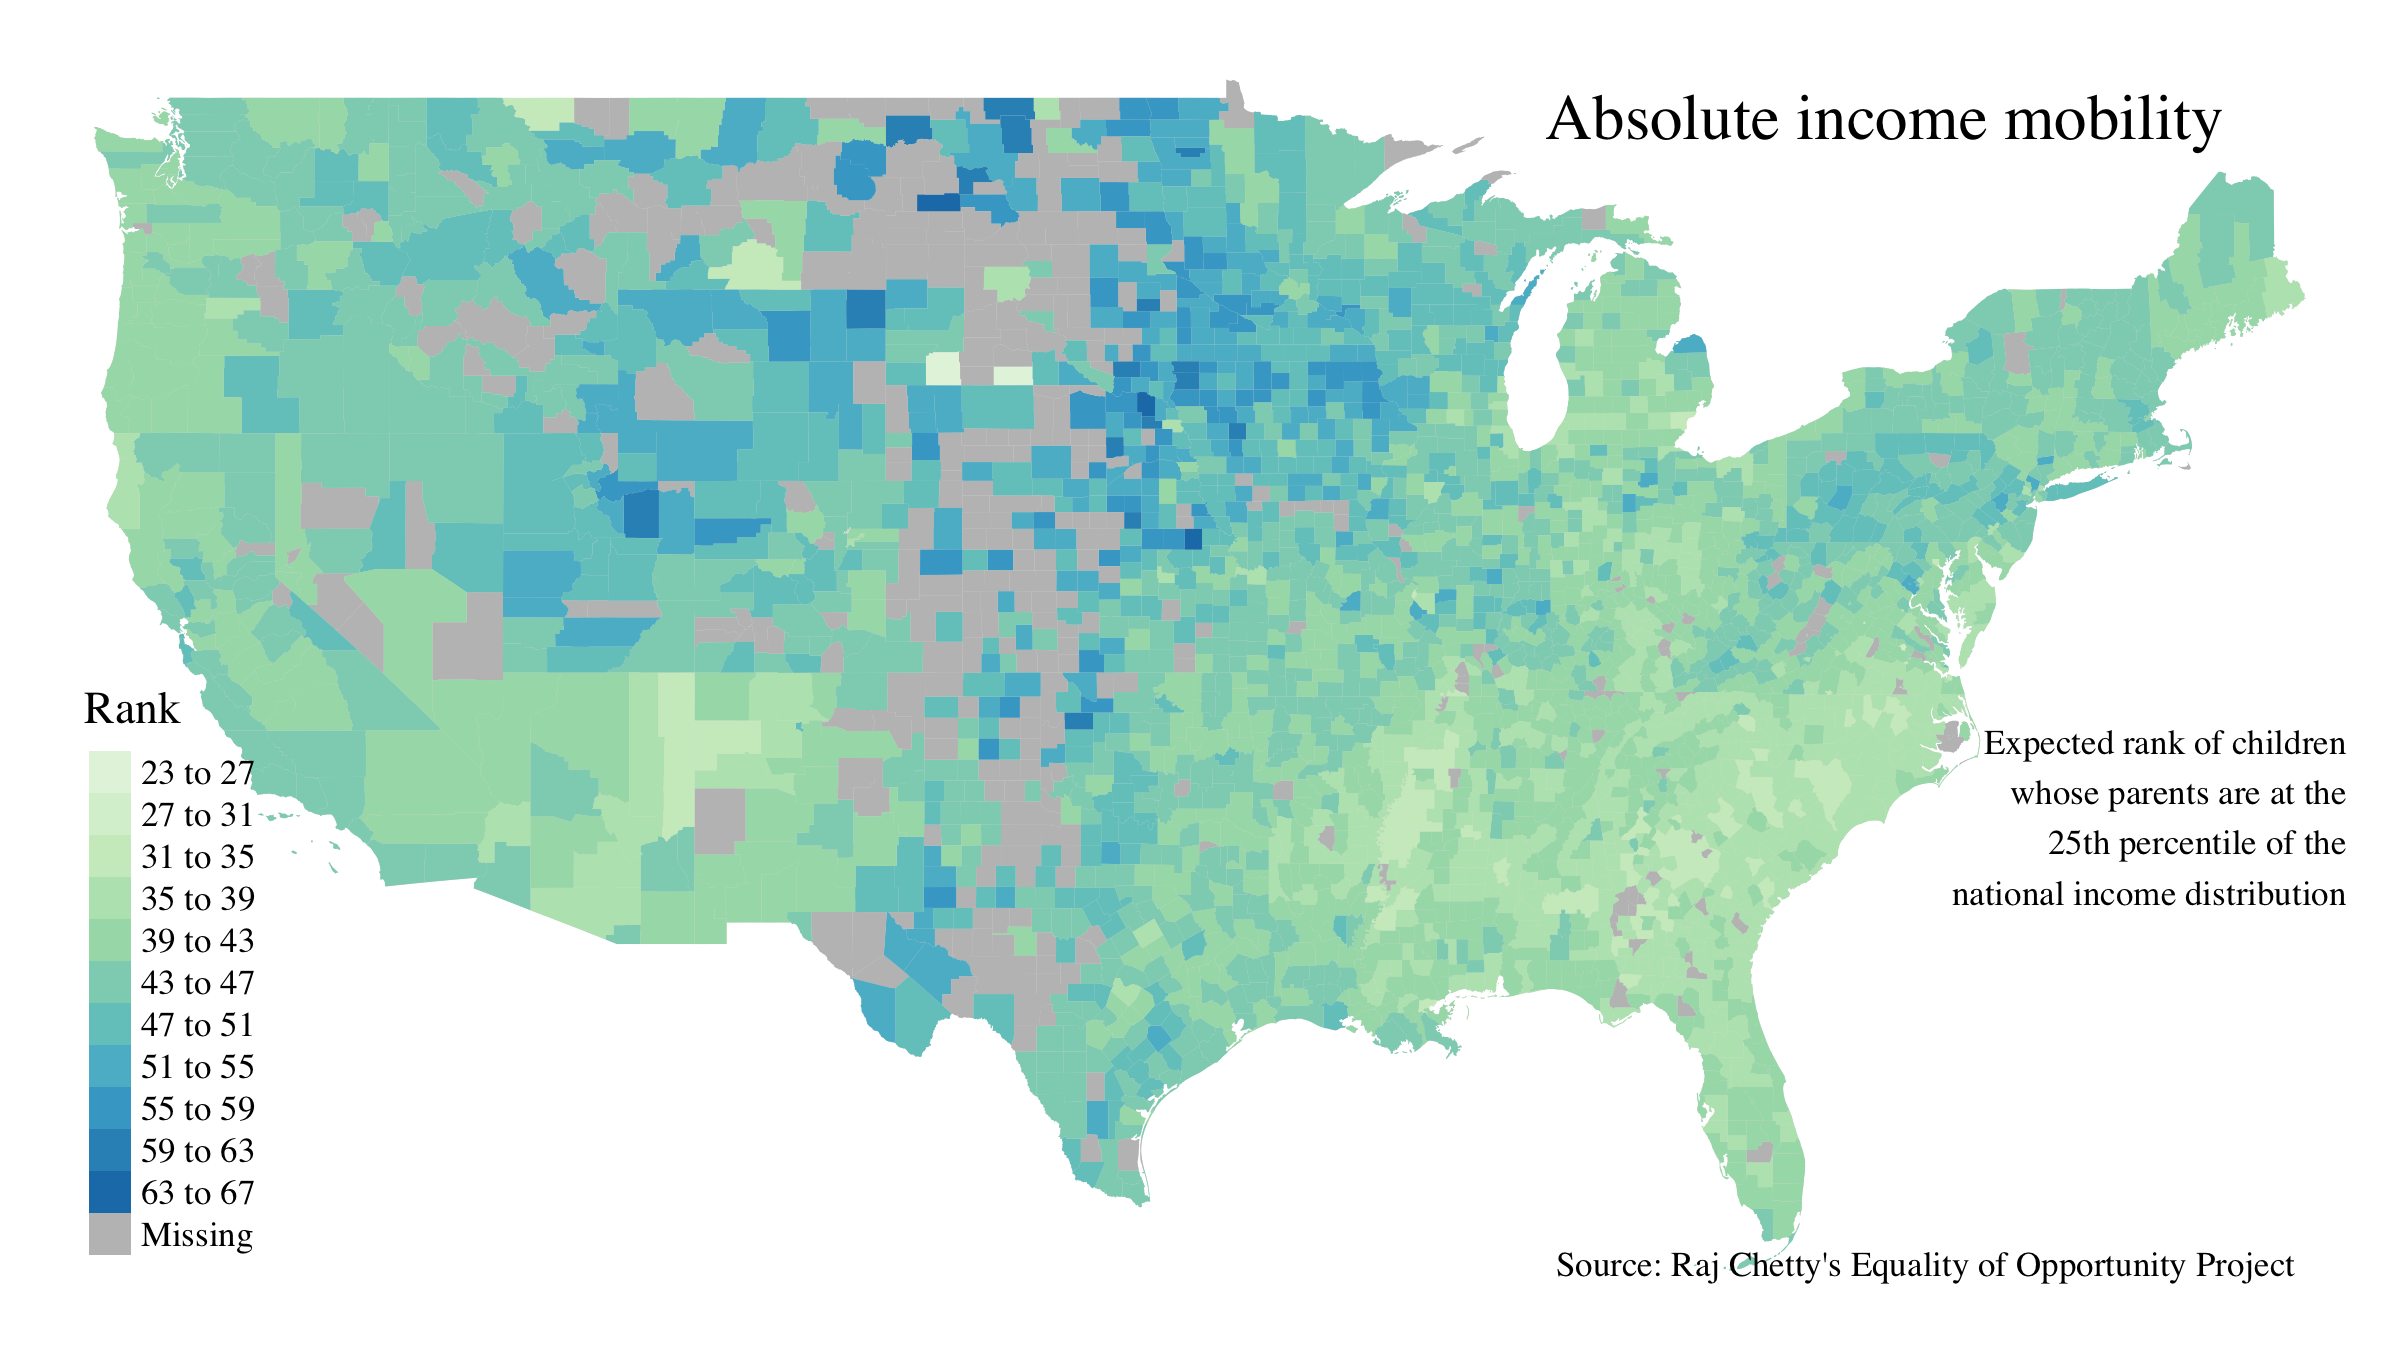
Some of the patterns in this map reminded me of another county-level map–that of intergenerational income mobility.2
Much of the same broad swathes of the upper Great Plains and Mountain West rank well on both measures. The South generally does poorly on both.
I ran a simple regression on these two variables.
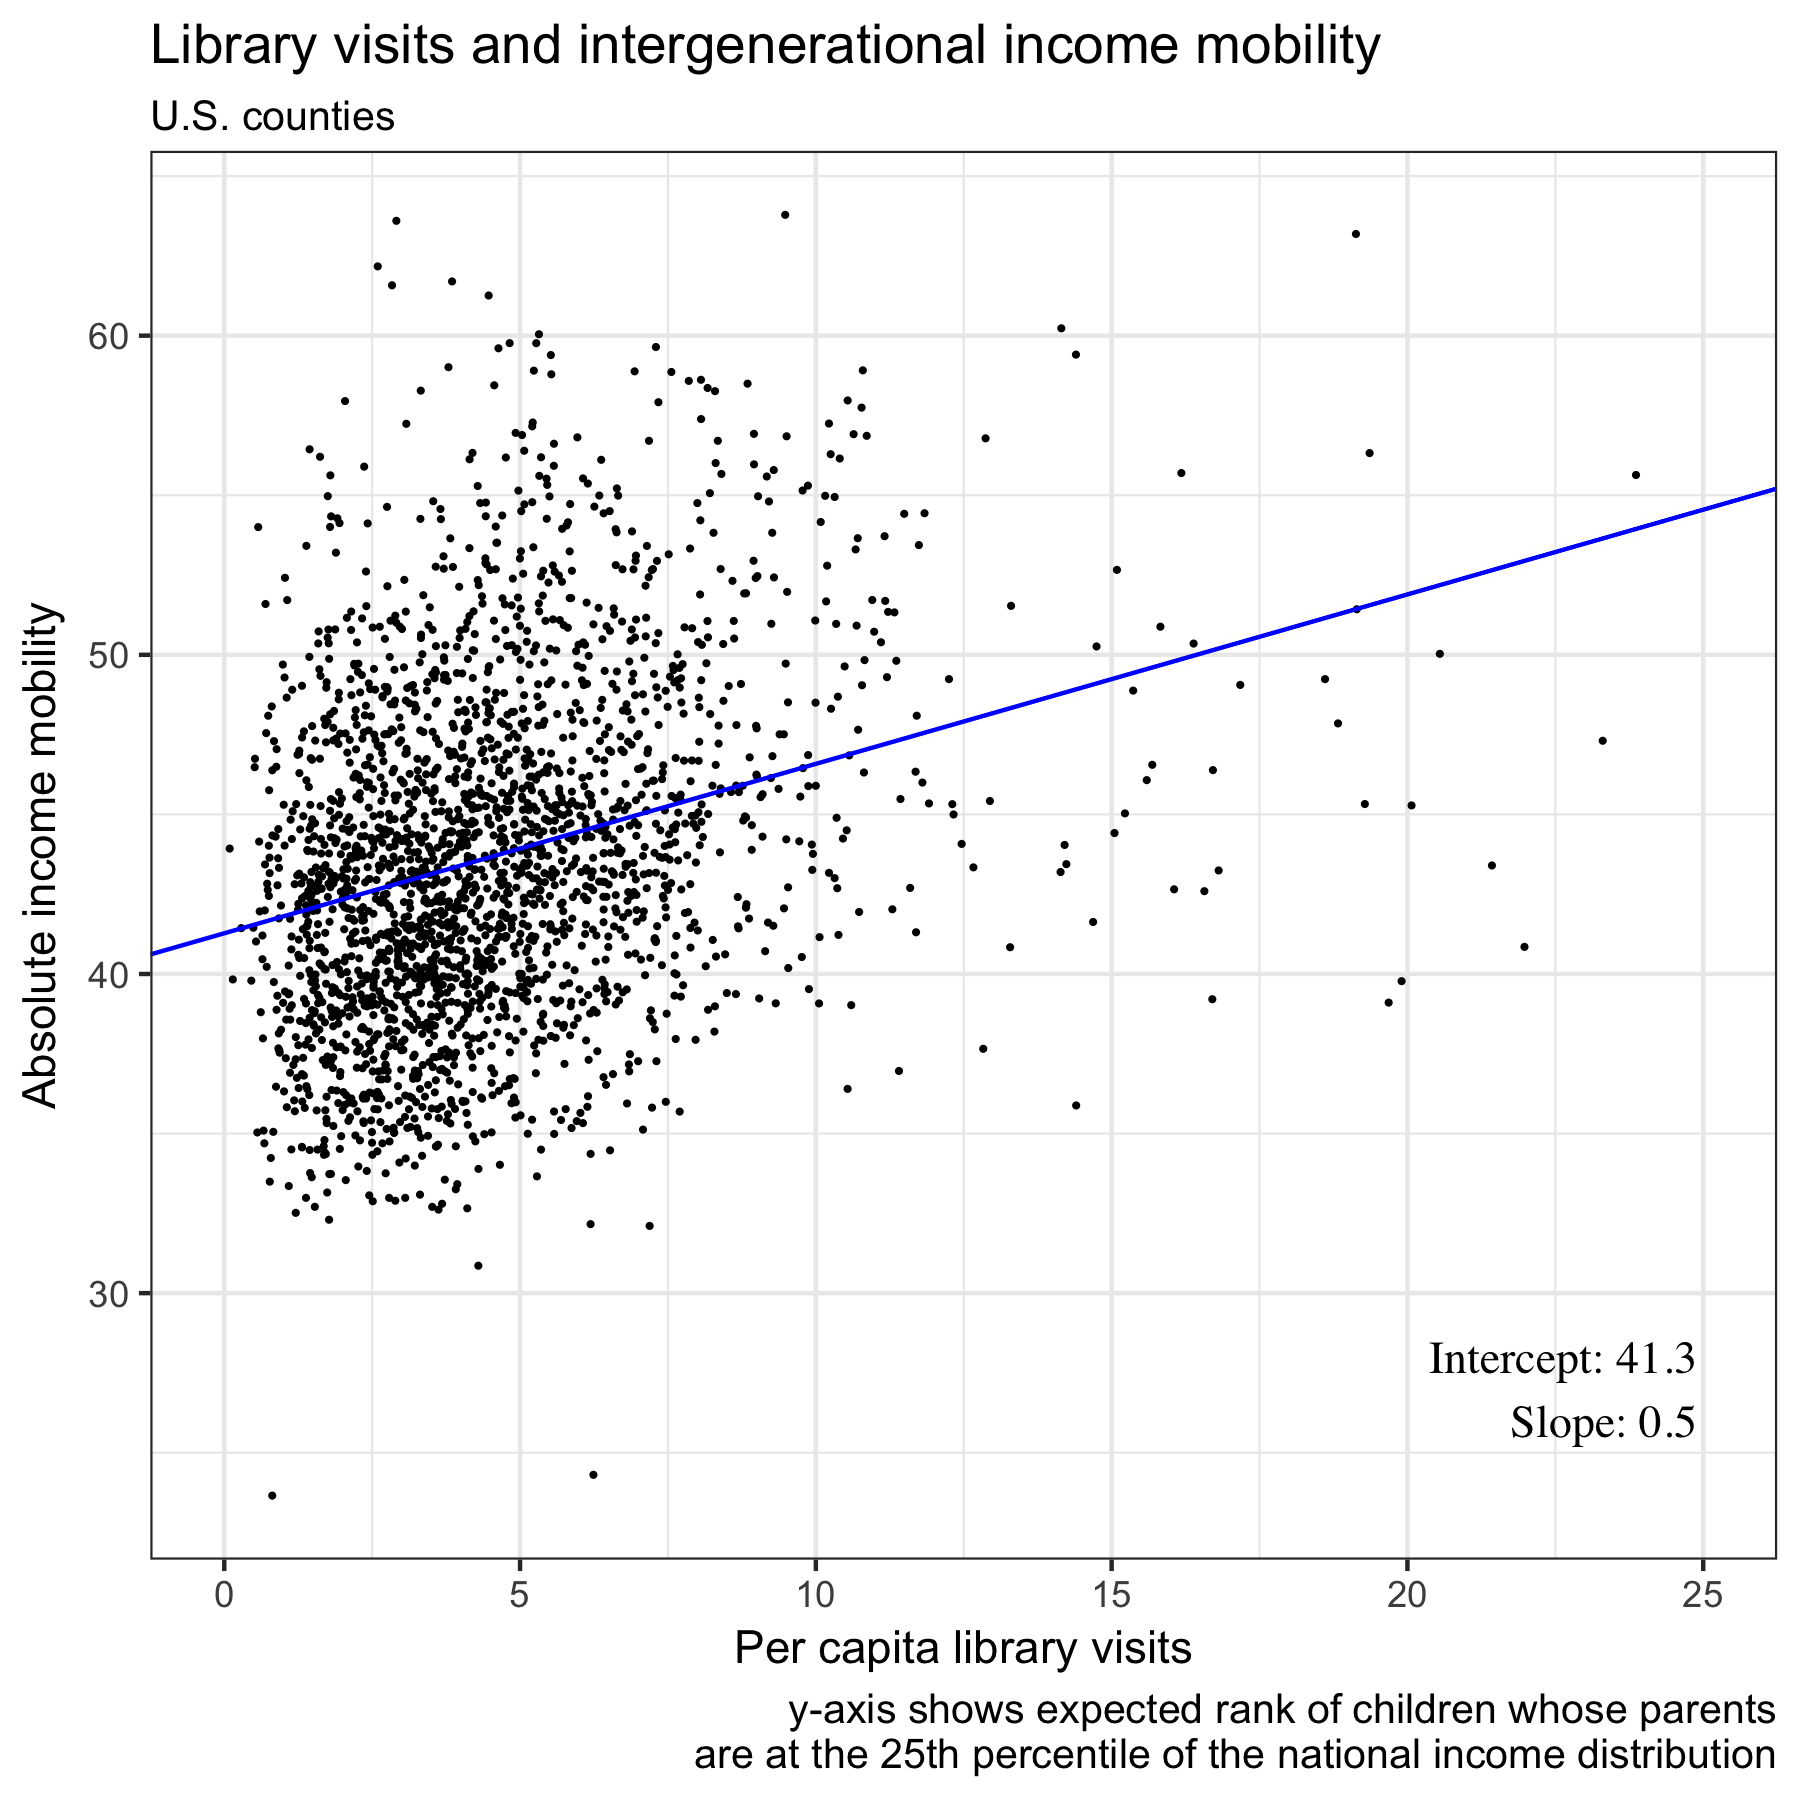
Increased per capita library visits are positively associated with increased intergenerational income mobility at a statistically significant level.
On average, an increase of 1 additional per capita library visit is associated with a 0.5 percentile increase in a child’s expected income rank, versus their parents’.
This isn’t to say that going to the library causes kids to become richer. There are also parts of the country with high library visits and low mobility. Look at the Pennsylvania / New York border, for example. Compared with the neighboring parts of New York, Pennsylvania’s northern counties are, if anything, better places to grow up poor. Yet those same parts of New York also enjoy markedly higher rates of library visits.
The parts of the Upper Midwest that score highly on both these measures are also well known for their high degrees of social capital and civic engagement more broadly. High library usage is likely another example of that.
This data is from an annual census conducted by the Institue of Museum and Library Services, a federal agency. The map is not an exact use of that data because public library service areas do not necessarily neatly follow county boundaries. I created these statistics by grouping all of the libraries in each county, adding up all of the visitors to these libraries, and then dividing that number by the total unduplicated population of the libraries’ service areas. If data is only available for one library district within a county, the whole county is colored with that per capita rate.↩
Chetty and Hendren, “The Effects of Neighborhoods on Intergenerational Mobility,” The Equality of Opportunity Project, 2017.↩