Trusting, but verifying the Census
Comparing data
When we read facts about the places we live, most often they are taken from census data. In many cases the census is the only source for our questions. But not always. Some features measured by the census are also measured in more thorough ways by other organizations. For example, the Milwaukee Assessor’s Office continuously collects information about every parcel of land in the City. The Census Bureau also measures some property data, but the two sources approach it from different angles. The City Assessor measures land use. Literally every square meter of the city must be accounted for. The Census measures people. So the housing data it gathers is the result of these interviews.
In this analysis, I compare the accuracy of census data to local city data on one simple issue–the number of housing units in a given geography.
Of course, all datasets can have errors. There are around 130,000 residential properties in Milwaukee, and I’m sure some of them contain mistakes. A landlord could potentially illegally hide a unit, or someone at the Assessor’s office could simply mis-key a number. However, I find that governments are generally good at collecting data related to their ability to tax. And residents are often eager contest their assessments when they are innaccurate. For the purposes of this analysis I’m going to consider the information from the City Assessor’s Master Property List (MPROP) to be the “objective” measure.1
A short Census intro
There are two kinds of census data. The most famous is the decennial census. Theoretically everyone fills this out once every 10 years. From 1970 to 2000, a sample of people were required to fill out an additional “long-form” census, which asked more detailed questions about a variety of topics. Beginning in 2005, the Census Bureau replaced the long-form census with a continous program called the American Community Survey (ACS). Results of the ACS are released annually in different “vintages.” A rolling 5-year average is released for all geographies. One-year estimates are released for areas with populations of at least 65,000.
Blocks groups and census tracts
For people wanting to study small geographies (like neighborhoods), the census provides two options, census tracts and block groups. Since 2000, the entire country has been divided into different tracts. The geographic size of the tract varies with population density. When population density is high enough, the Census Bureau also provides statistics for block groups, which are sub-divisions of census tracts usually containing 600-3,000 people.
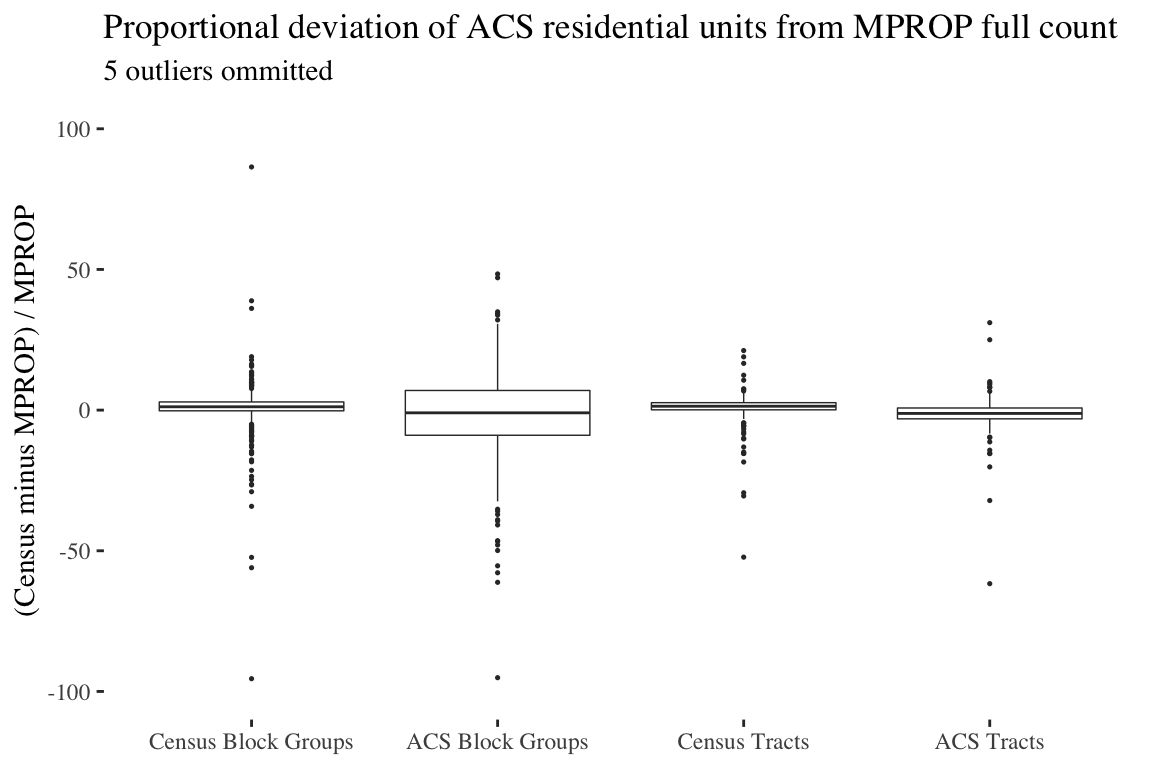
Fortunately for us, total housing units is measured by both the short-form census “everyone” completes and the ACS (which is a random sample of the population). Accordingly, we can test the relative accuracy of the decennial census as well as the 5-year ACS at both the block group and tract levels.2
In absolute terms, the median difference between the 2010 full count census and the 2010 MPROP file was 1.8% for tracts and 2.1% for block groups. As expected, variations were larger for the ACS, which is an estimate not a full count. The difference between the 2012-2016 ACS and a comparable 2012-2016 MPROP average was 2.1% for tracts and 8.1% for block groups.
So what explains the much greater error size for the ACS block group data? Since, the ACS is a true survey (unlike the decennial census) it comes with a margin of error set at the 90% confidence interval. In other words, assuming the ACS is truly a random sample of the target population, we should expect the real number to fall within the margin of error 90% of the time.
In fact, the block group MPROP housing unit count falls within the ACS 5-year margin of error 90.8% of the time. For tracts, the MPROP count lands inside the ACS margin 91.9% of the time.
In other words, all of the inaccuracies in the ACS data (for both tracts and blocks) can be entirely explained by random sampling error. In survey research this sort of “known unknown” is just the cost of doing business. The only way to decrease this error is to increase the sample size–a costly proposition.
Takeaways
At least on this measure, the census is quite accurate. As expected, the decennial full count census has lower errors than the American Community Survey. But ACS estimates at the tract and block group level still fall within the margin of error at the expected rate. There is actually very little difference between the accuracy of decennial tract data and 5-year ACS estimates.
I work with neighborhood level census data quite a bit, so here are the lessons I’ve taken from this project.
- If you’re working with the decennial census, both block groups and census tracts are very accurate.
- If you’re working with the ACS, census tracts are much better than block groups.
- But, ACS block groups are as accurate as the census represents them to be. Just make sure you take into account the margin of error.
- If you are measuring a fairly stable characteristic, the increased accuracy of the decennial census may be worth the sacrifice of less-contemporary data–particularly for block groups.
There are many good reasons to compare MPROP and census property data, but they do have some important differences. The MPROP 2010 data is taken from December 2010, while the decennial census is as of April 1st. This difference could explain the very small number of large outliers in the MPROP/census 2010 comparison, since large apartment buildings could have been completed or destroyed during the intervening 9 months. Relatedly, I generated the 2012-2016 MPROP number by adding the number of units for each geography from the end-of-year archived MPROP files and dividing by 5. This is the closest possible approximation to the 5-year ACS method, which combines continously distributed surveys in such a way that no single year or month is overrepresented.↩
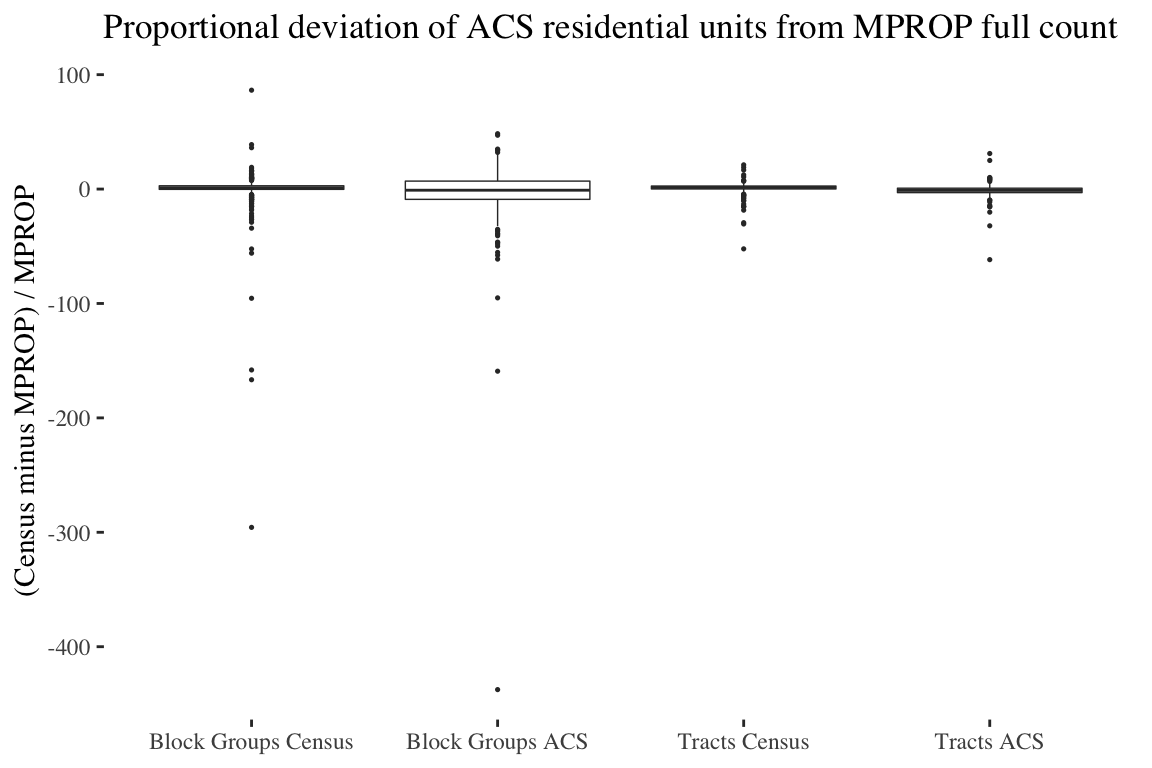
Below is a version of the above table with outliers included.
 ↩
↩